Bitcoin price continues to struggle to close above the $28,000 level on the last working day of the week. Despite a good start to the week and October, the crypto markets cannot sustain their upward movements due to the lack of a significant increase in trading volumes. Decreasing investor interest since May has kept BTC price within narrow ranges.
Crypto Analyst’s Prediction
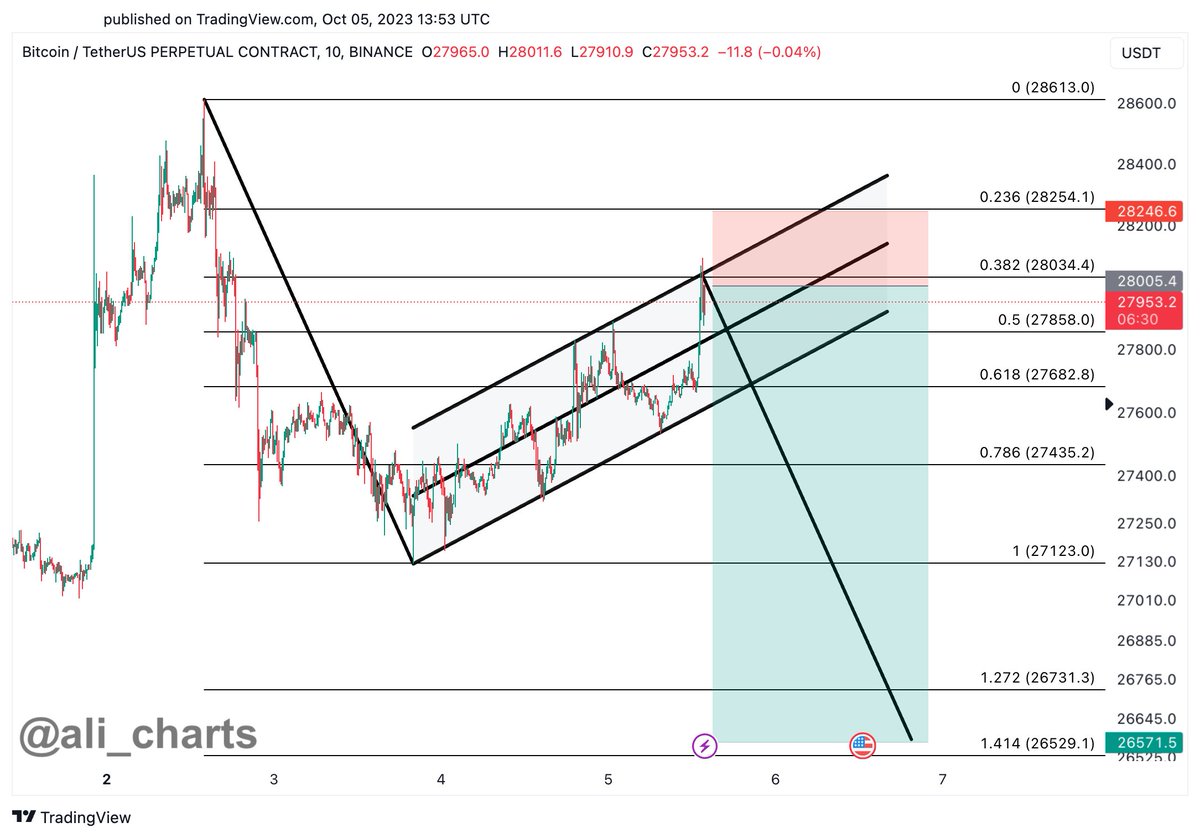
Ali Martinez, one of the popular figures followed by investors, recently shared his latest predictions about the markets. According to the analyst, the king cryptocurrency is forming a classic bear flag pattern, and losses could deepen.
Bear flag formations are considered popular bearish signals in technical analysis. They are famous for predicting downward movements in advance. They occur when the price consolidates upward after a strong downtrend but struggles to break an important support level.
“Bitcoin is forming a classic bear flag pattern, which generally indicates that the BTC downtrend will continue. Is there any hope? I will only follow a tight stop loss of 0.86% and a potential profit-taking level of close to 5%.”

How Much Will Bitcoin Be Worth?
According to the analyst’s chart, BTC price is facing a risk of dropping to $26,751 as it failed to reclaim support at $28,034. Different experts had previously stated that closing below $27,500 could accelerate selling towards $26,800.
Today, we will see the release of very important macro data. Employment and wage growth data can shape the Fed’s decision at its November 1st meeting and trigger volatility in the crypto markets. If the employment data shows strong growth and wage increases above expectations, it could turn October into a bearish period after years.

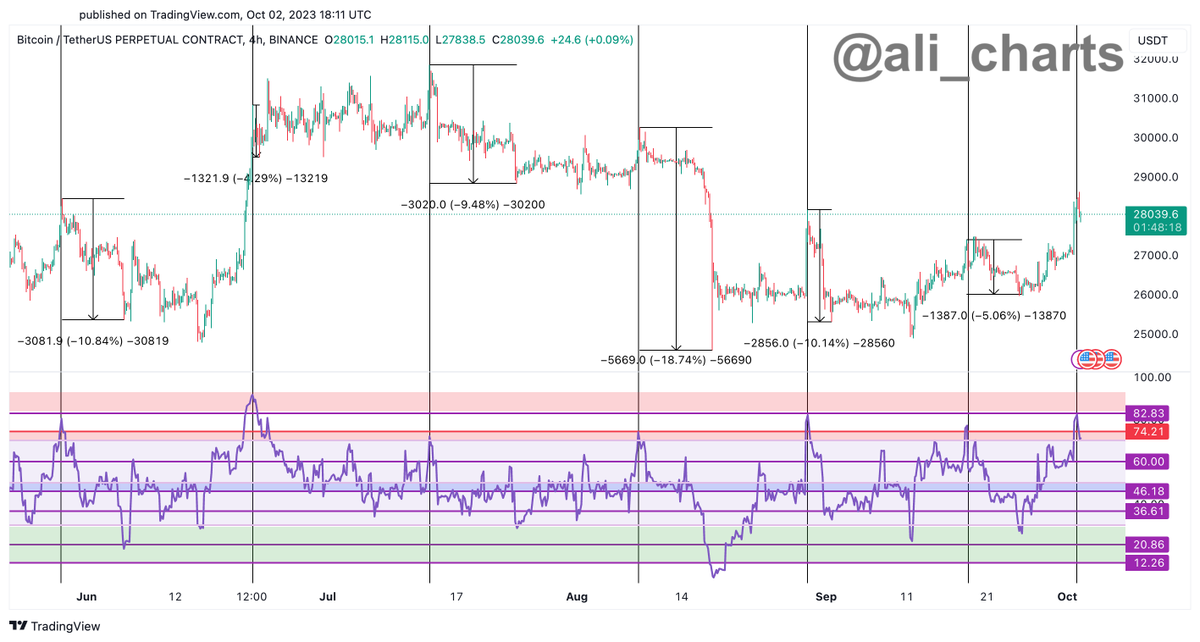
According to the crypto expert, the RSI data also supports the expectation of a decline.
“Pay attention to BTC’s four-hour chart RSI reaching or surpassing 74.21. Every time this happens, BTC tends to retreat. The RSI on the four-hour chart recently reached 82.83!”

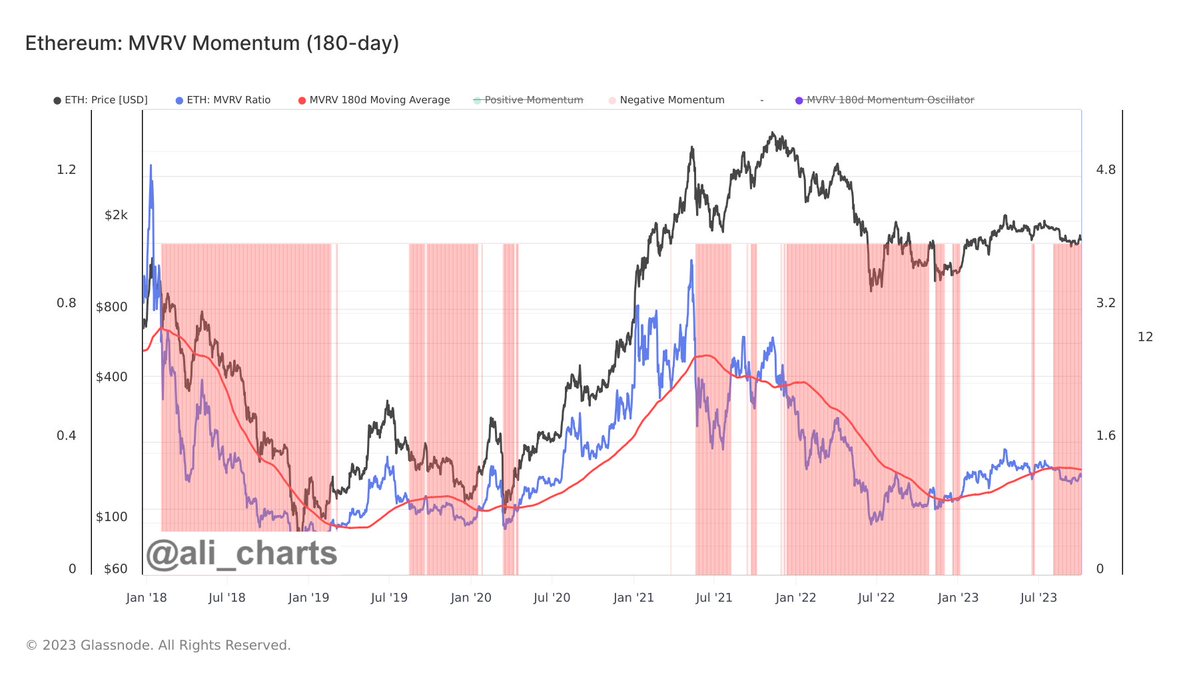
Martinez also commented on the king of altcoins, Ether;
“When Ethereum‘s market cycles, MVRV (blue line) strongly surpasses the 180-day SMA of MVRV (red line), it transitions from a downward to an upward trend. Currently, ETH is in a distribution phase and is awaiting intensive accumulation.”

 Türkçe
 Español


