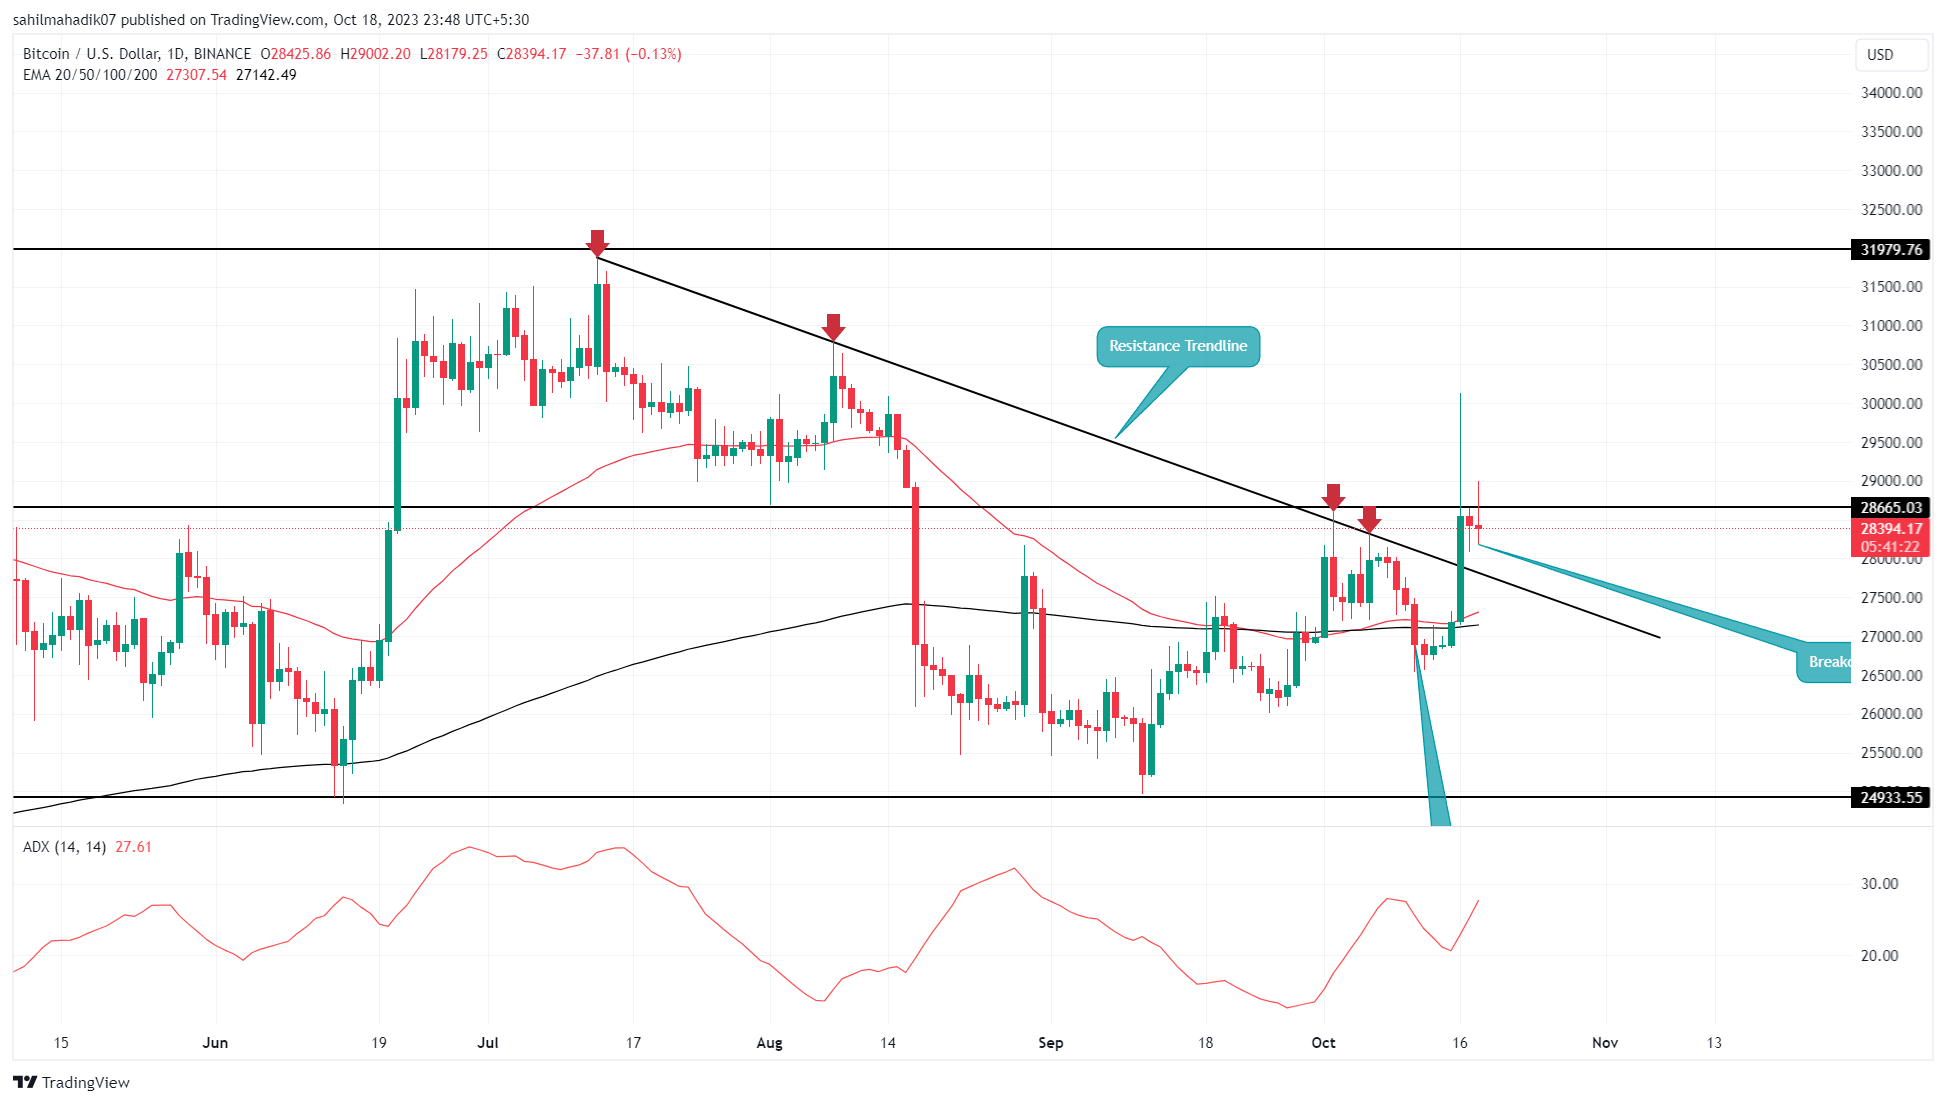
Bitcoin price made a decisive breakout above the descending resistance trend line on October 16th, fueled by strong buying pressure. This trend line had been guiding the largest cryptocurrency’s three-month-long decline, and its breakage signals a potential new phase of recovery. However, this surge was largely influenced by a debunked news of the SEC approving a spot Bitcoin ETF, which raises questions about the sustainability of the resistance trend line breakage.
Bitcoin Price Analysis
Since the first week of September, Bitcoin has started a relief rally, recovering from the psychological support level of $25,000. Over the past five weeks, the largest cryptocurrency has gained approximately 13.5%, reaching a current trading price of $28,380.

During this upward trend, BTC experienced a significant breakout from the resistance trend line that framed its three-month decline. However, the debunking of the speculative spot Bitcoin ETF news prevented the largest cryptocurrency from surpassing $30,000.
Currently, the price of BTC is trading with a 0.2% intraday loss and preparing to retest the recently broken trend line, which has now turned into a support trend line. This retest will be crucial in determining the sustainability of the breakout and the continuation of the recovery. If the momentum continues after the retest, there could be a 12% rise towards the $32,000 level.
Bitcoin Analysis: Possibility of Bull Trap
If it is proven that the recent price movement in Bitcoin is purely emotional and the price fails to stay above the broken trend line, further downside could occur. Such a downward breakout would invalidate the breakout on October 16th and be considered a bull trap, leading to increased selling pressure. In this bearish scenario, the largest cryptocurrency is likely to experience a 10% decline and potentially revisit the $25,000 support level.
The increasing slope of the Average Directional Index (ADX) on Bitcoin’s daily price chart indicates that buyers have the power to extend the recovery trend. The flattening 50-day and 200-day Exponential Moving Averages (EMA) suggest a sideways dominant trend.

 Türkçe
 Español


