This week, a decision made in the Ripple and SEC case caused a significant rise in the cryptocurrency market. With the leadership of Ripple and Bitcoin, many altcoins experienced substantial increases, bringing joy to investors. So, what is happening with memecoins that have provided significant gains during rally periods and are inspired by meme culture? Let’s examine together.
Dogecoin Chart Analysis
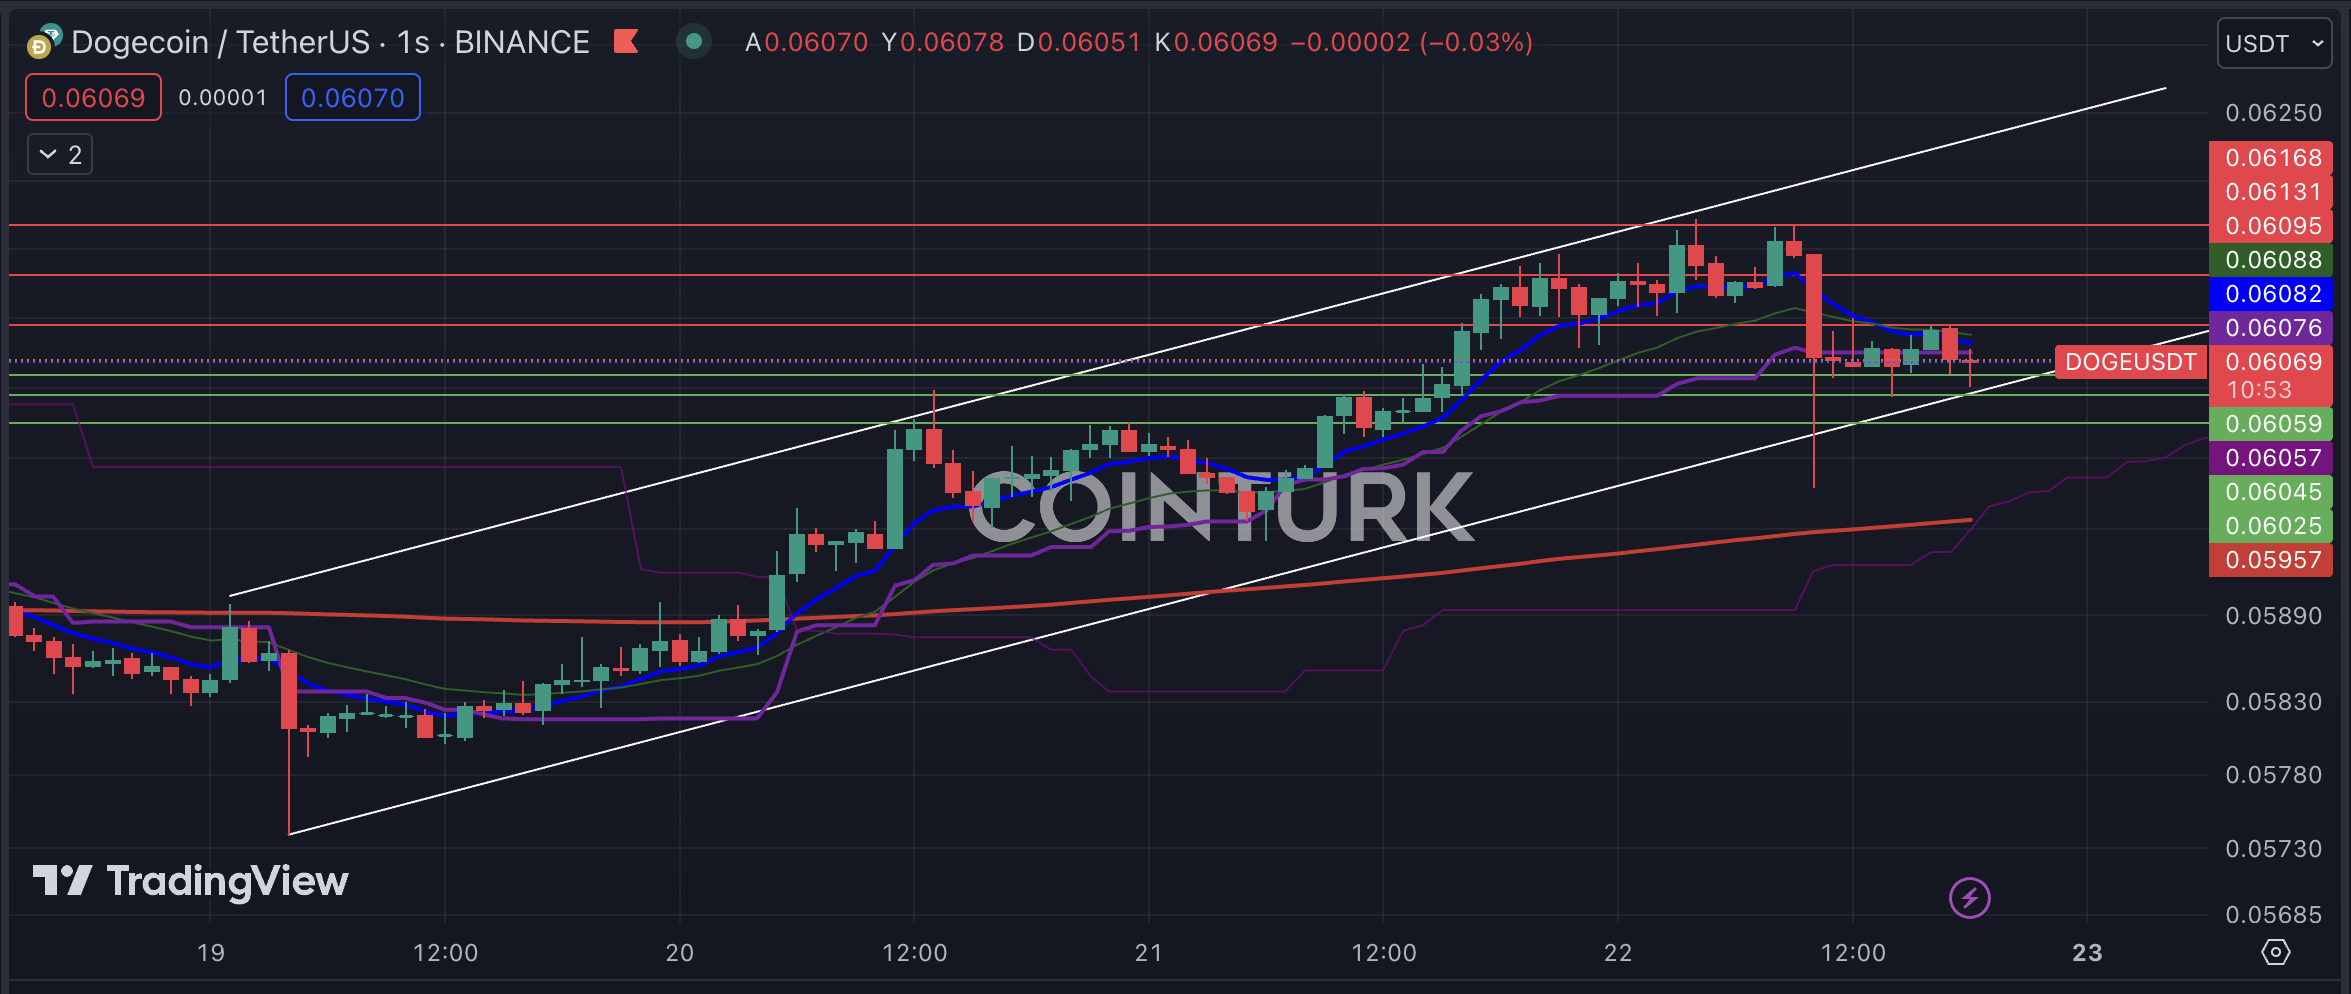
There has been a significant increase in Dogecoin, the most valuable memecoin, in recent days. However, the fact that Elon Musk has not made any shares recently is particularly worrying for DOGE investors. A move from the X side could trigger a significant rise.
The support levels to be considered on the hourly chart for DOGE are respectively; $0.06059, $0.06045, and $0.06025. Especially, the completion of the hourly bar closing below the $0.06045 level can disrupt the formation structure and increase the possibilities of a decline for DOGE. The levels to be followed for DOGE are respectively; $0.06095, $0.06131, and $0.06168.
Shiba Inu Chart Analysis
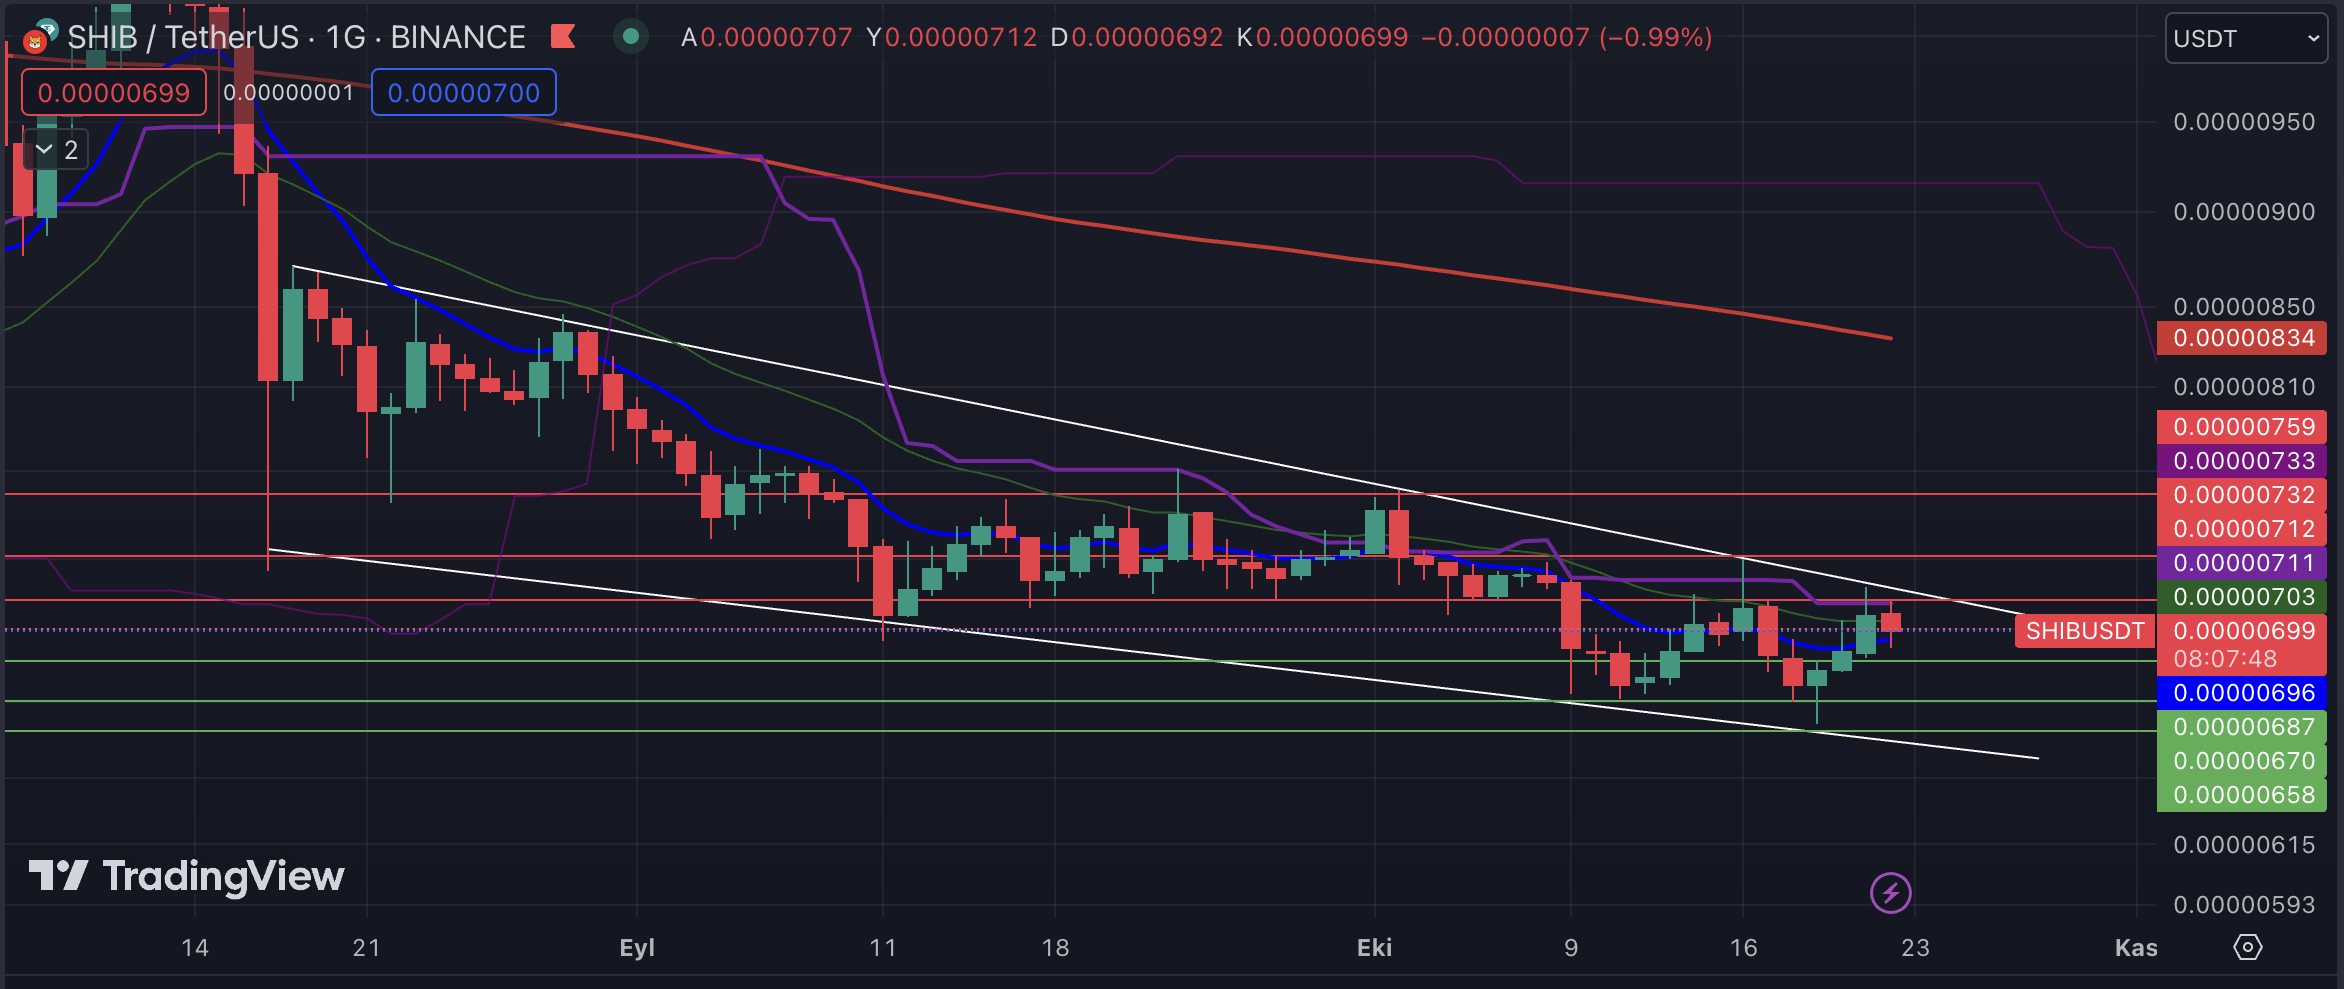
Concerns about the Shibarium network issue that occurred in August still persist for Shiba Inu. Investors are rightfully concerned about SHIB, which cannot take advantage of such a market environment compared to many altcoins. Positive news flow should now be provided for the project, where whale exits continue.
The significant support levels that need to be considered for SHIB on the daily chart are respectively; $0.00000687, $0.00000670, and $0.00000658. Especially, the completion of the daily bar closing below the $0.00000658 level ensures the completion of the descending channel formation and leads to significant losses. The resistance levels to be followed for SHIB are respectively; $0.00000712, $0.00000732, and $0.00000759.
Floki Chart Analysis
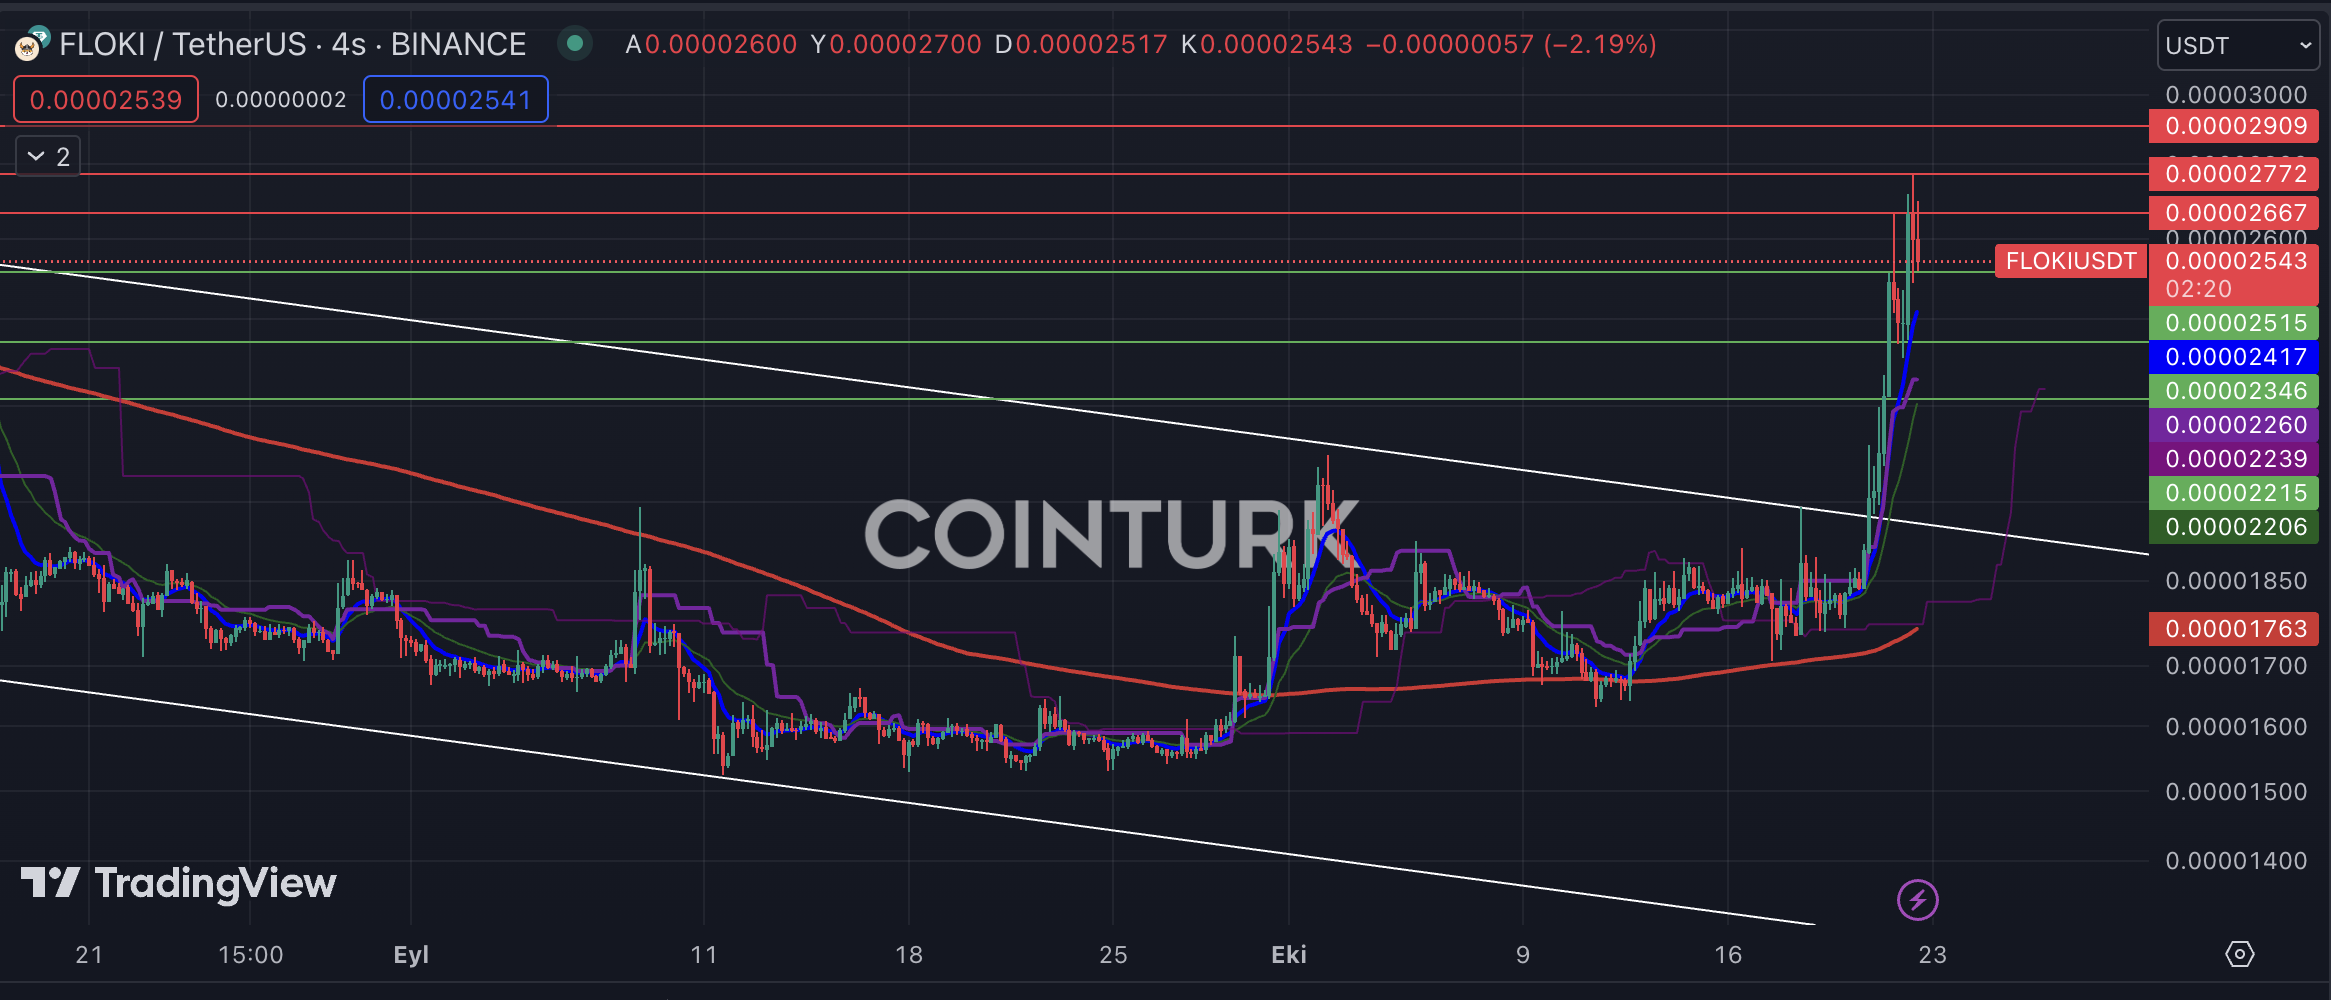
Although not as popular as Dogecoin and Shiba Inu, Floki is a memecoin project closely followed by Turkish investors. With partnerships established since 2021, FLOKI, which has been frequently mentioned, managed to break the descending channel formation and gained significant momentum in recent days.
The support levels that need to be considered for FLOKI on the 4-hour chart are respectively; $0.00002515, $0.00002346, and $0.00002215. Especially, a breakthrough below the $0.00002215 level can cause the EMA 7 and EMA 21 levels to act as resistance. The resistance levels to be followed for FLOKI are respectively; $0.00002667, $0.00002772, and $0.00002909.

 Türkçe
 Español

