The sentiment in the cryptocurrency market has improved in the past few days due to the approval of the Bitcoin (BTC) ETF in the US and the upcoming April 2024 halving. Especially Chainlink (LINK) has surpassed an important long-term resistance and the critical $8.5 area as BTC reaches new highs. Here are the details!
Critical Area in LINK!
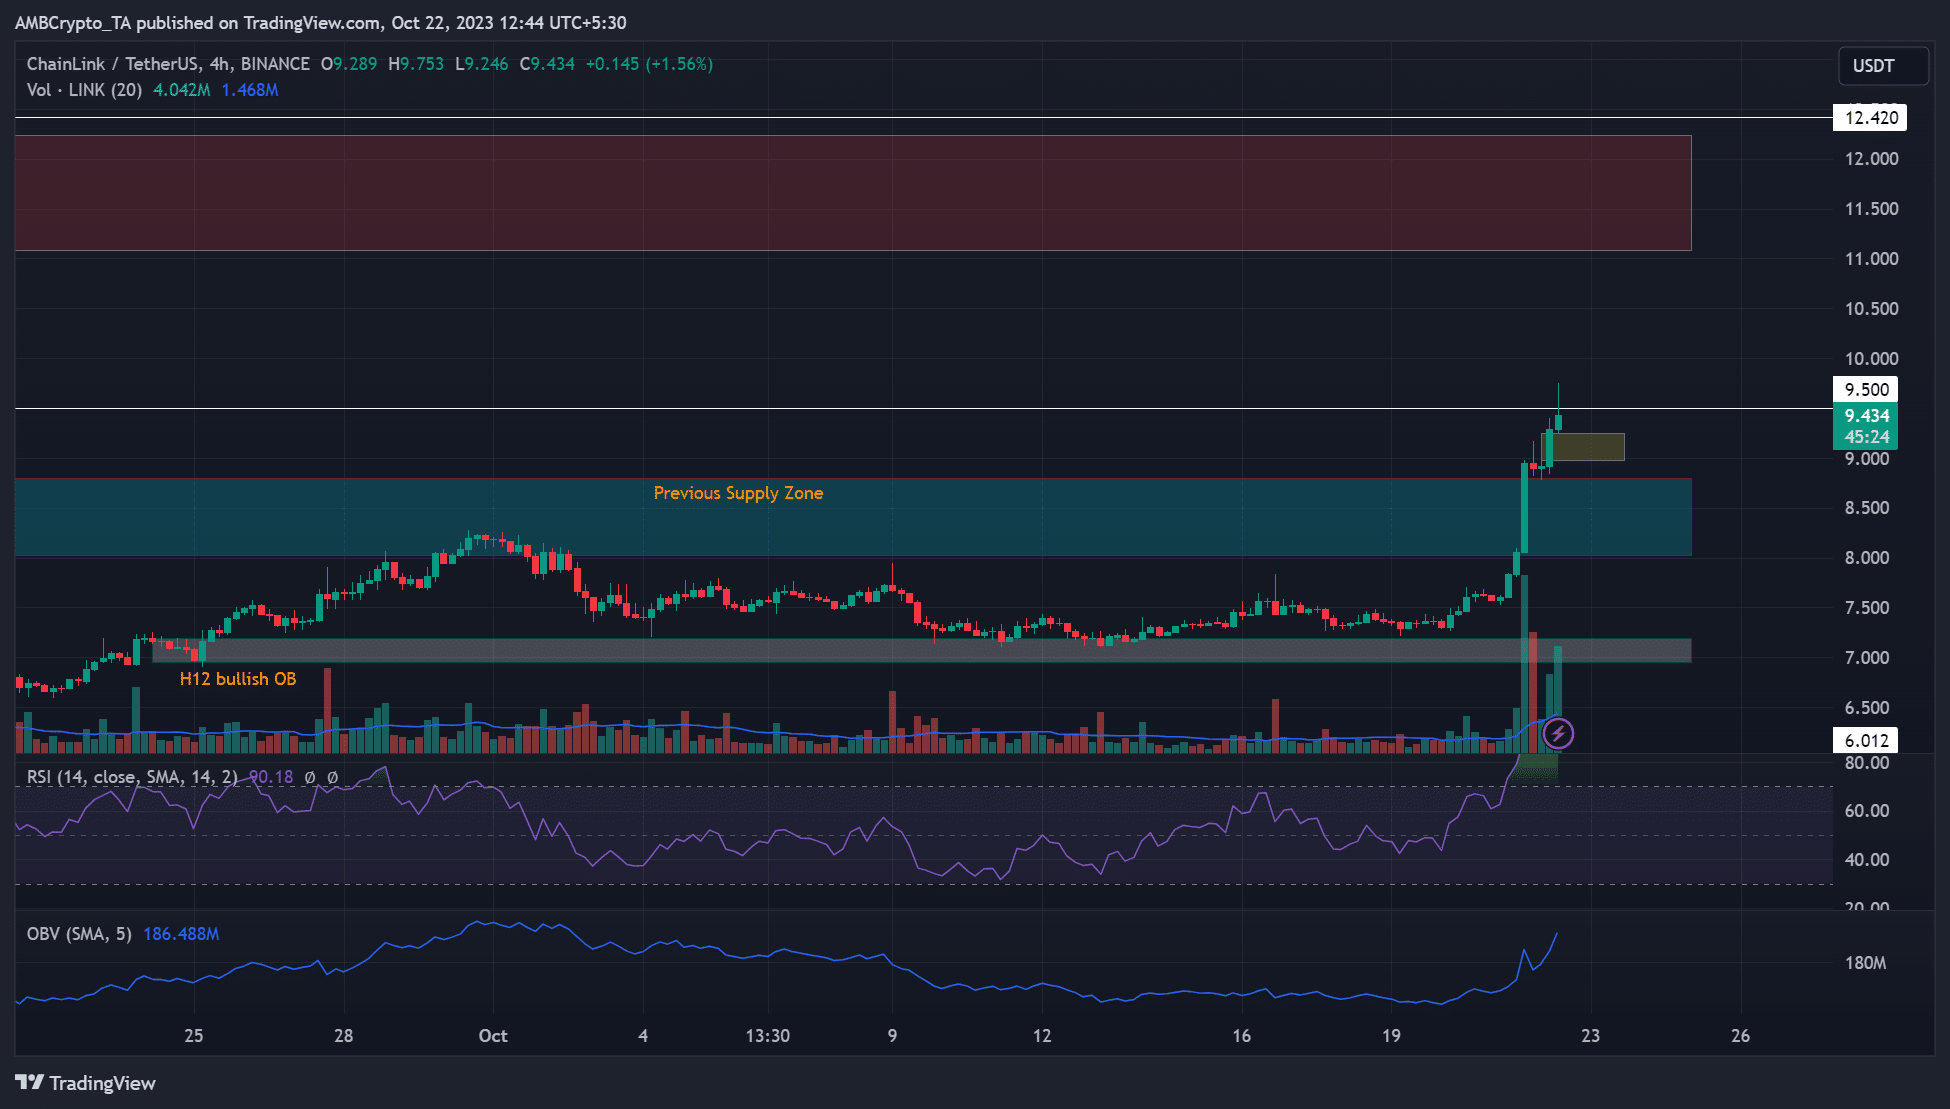
A previous LINK price analysis revealed a contradiction between the recent upward movement and on-chain metric analysis. However, the upward momentum has seen LINK break a several-month resistance at $8. Bulls defended their recovery gains in the 4-hour chart, with liquidity and price imbalances at levels of $8.98 and $9.24, just below the immediate general resistance level at $9.5. Short-term bulls had already defended the previous supply zone between $8.0 and $8.8 at the time of writing.
Therefore, if BTC continues its upward momentum in the next few hours/days, the previous supply zone and liquidity on the charts could be key support levels for late bulls. However, late buyers may be aware of the hurdles at $9.5 and the daily descending order block (OB) between $11.0 and $12.0.

On-Chain Data in LINK!
A pullback below the previous supply zone, contrary to assumptions, could confirm the increasingly negative sentiment and tilt the balance in favor of sellers. In addition, the rising OBV indicates that strong demand in the spot market may delay a sharp pullback. However, the overbought condition of the relative strength index (RSI) was a concern if BTC were to suffer further short-term losses.
According to Coinalyze, the sentiment in the futures market was positive based on the funding rates. Additionally, the demand in the derivatives segment recorded a good development, as indicated by the increase in open interest (OI) rates. The rising and positive Accumulative Swing Index (ASI) also strengthened the long-term bullish trend. ASI tracks the strength of price volatility and improvement could indicate the dominance of buyers.

 Türkçe
 Español


