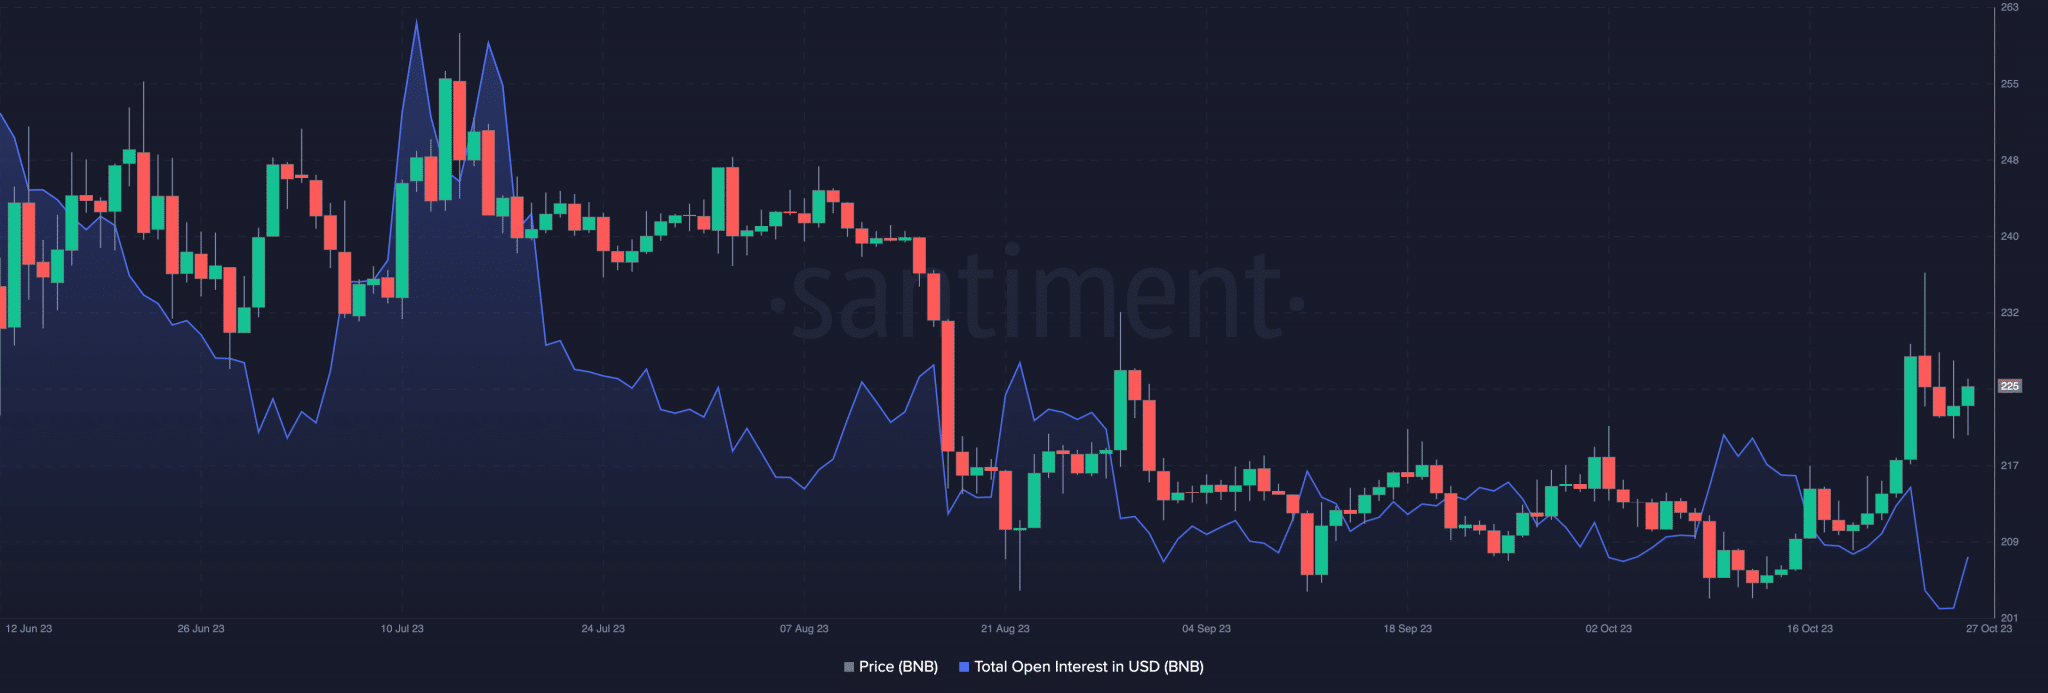
According to data from leading analytics company Santiment, the price of Binance Coin (BNB) has been trending downwards after reaching $234 on October 24th. This decline has been accompanied by a significant decrease in the token’s open positions, indicating that investors are closing their trading positions.
BNB Report from Coinglass
The popular altcoin is currently trading at $225.61, experiencing a nearly 5% decline in the past three days. Coinglass data reveals that the futures open positions have decreased by 8% since October 24th, reaching $304 million.
The on-balance volume (OBV) of BNB on the daily chart showed a decrease in trading volume during the specified period. A declining OBV, along with falling prices, can indicate a weakening buying interest or an increasing selling pressure. Despite the recent price drop suggesting a slowdown in buying momentum, the token’s direction movement index indicator indicates that the bulls continue to dominate.
This indicator measures the strength and direction of a trend in the market. At the time of writing, the positive directional indicator at 29.98 stood firmly above the negative directional indicator at 9.30. This positioning of the indicators confirms the upward trend and may indicate that buyers are stronger than sellers in the market.

Key Metric for BNB
Similarly, the average directional index (ADX) of the token reached 30.70. ADX helps determine whether the market is in a strong trend or in a range-bound phase. An ADX value above 25 is interpreted as an indication of strengthening trend. The 25 level is often used as a threshold to distinguish between trending and non-trending market conditions.
Furthermore, BNB’s fundamental momentum indicators were seen above the neutral lines. For instance, the relative strength index (RSI) of the token was 63.42, while the money flow index (MFI) was 65.25. These values suggest that BNB’s buying momentum may have experienced a slight decline in the past few days but still surpasses the selling pressure.

 Türkçe
 Español


