Investors in the cryptocurrency market continue to be happy as the days go by. Bitcoin, which ended October with a significant gain of 28%, has also led to the revival of the altcoin market. In particular, any development in Bitcoin spot ETF applications will accompany the preparation of a rally in the cryptocurrency market in the future. So what’s happening in the altcoin market? Let’s examine it in three headings.
Solana Chart Analysis
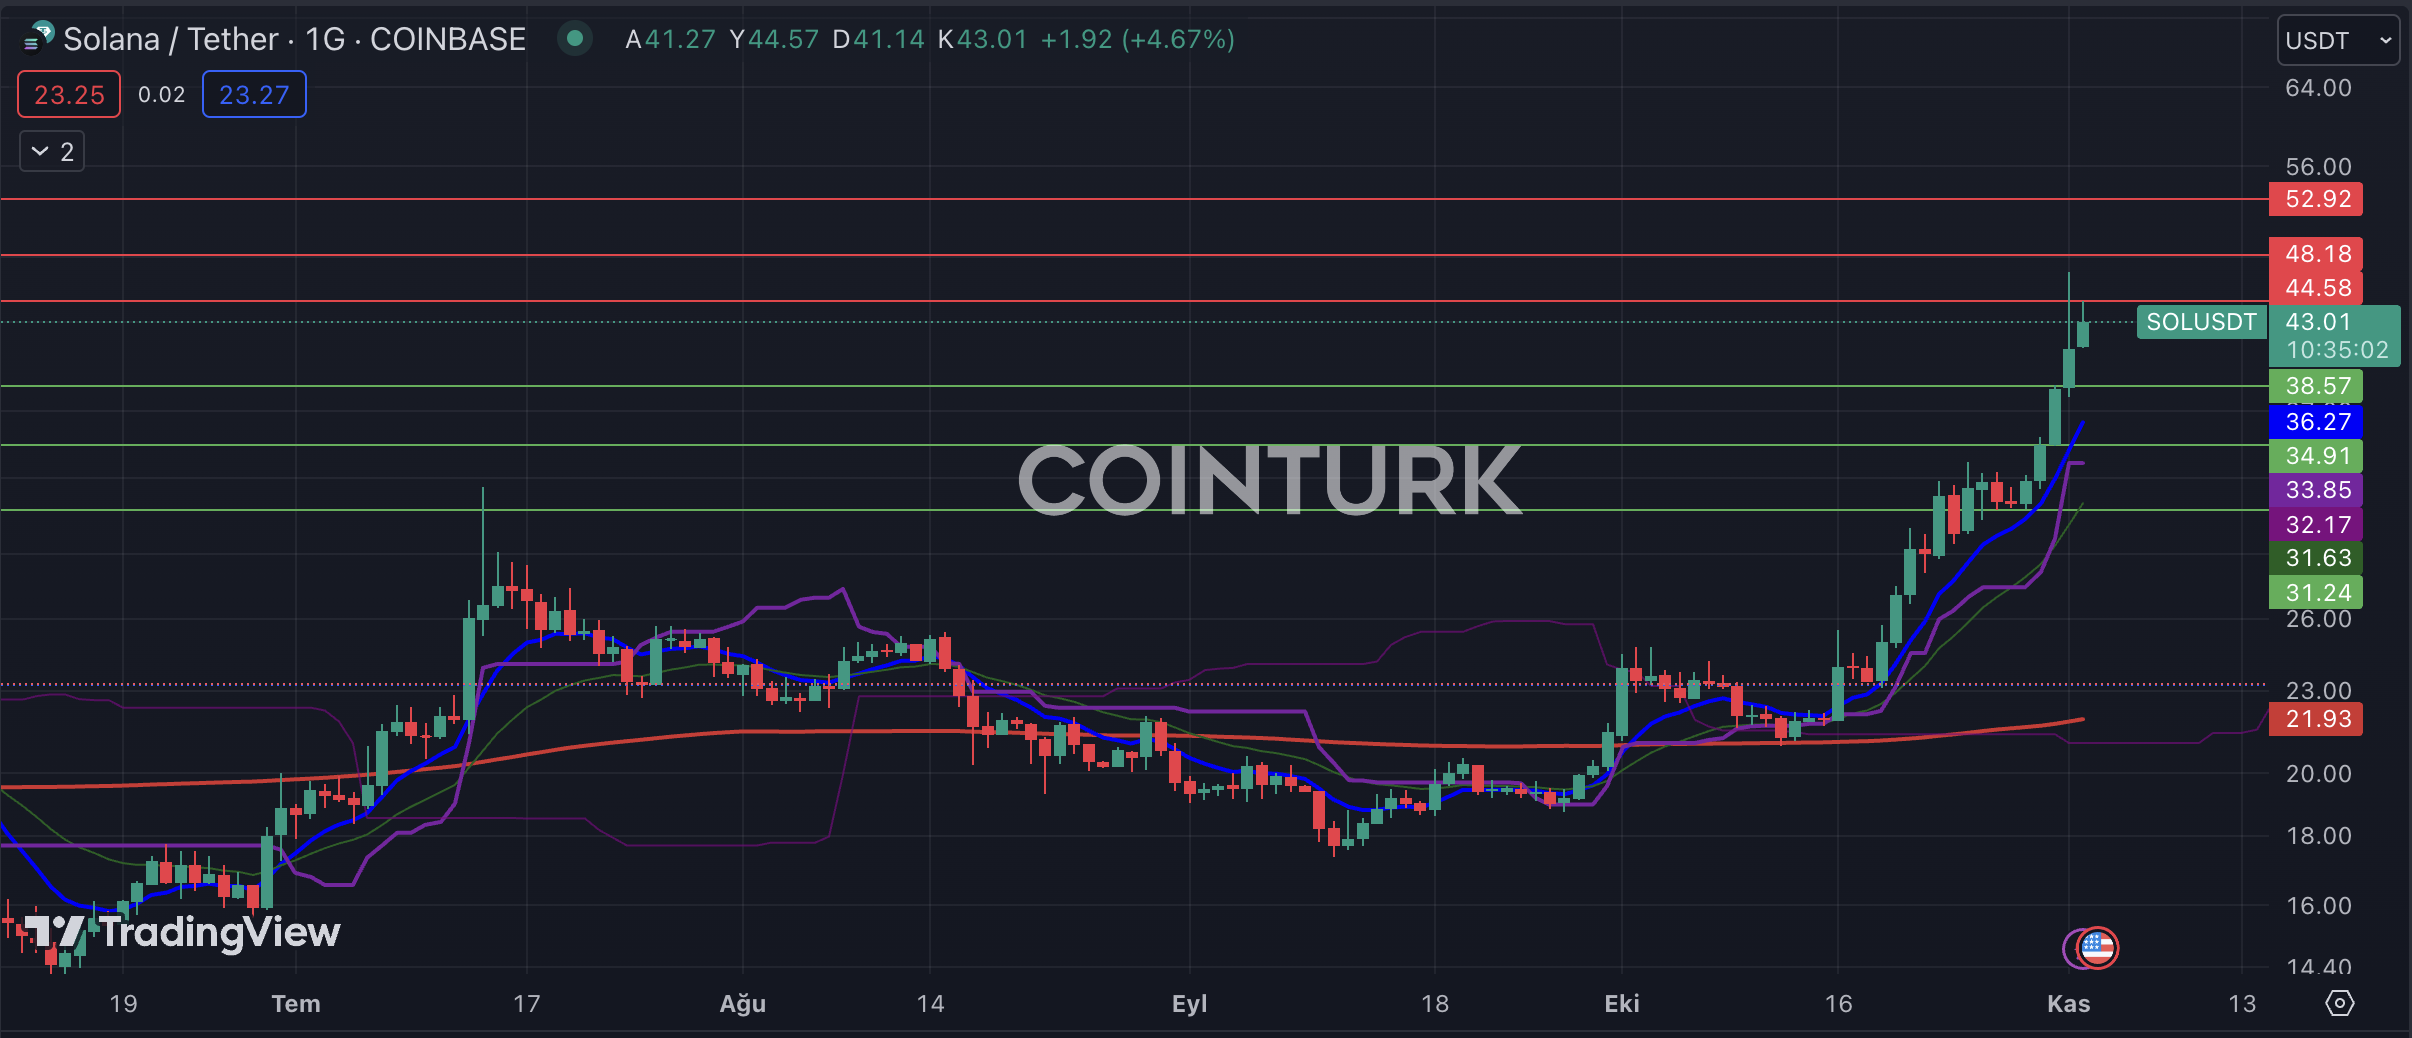
Solana, which has provided gains of over 100% in just two weeks, continues to make its investors happy. With this important momentum, the only obstacle to further growth for Solana could be the SOL assets held by the bankrupt cryptocurrency exchange FTX. Any selling pressure that may occur on this front will have a negative impact on the SOL price.
The support levels that need to be considered in Solana’s daily chart are respectively $38.57, $34.91, and $31.24. In particular, a daily bar closing below $31.24, where EMA 7 and EMA 21 intersect, will slow down the upward momentum in Solana. The resistance levels to be followed for SOL are respectively $44.58, $48.18, and $52.92. In particular, a daily bar closing above $48.18, which has not been seen since August 2022, will accelerate the upward momentum for SOL.
Avax Chart Analysis
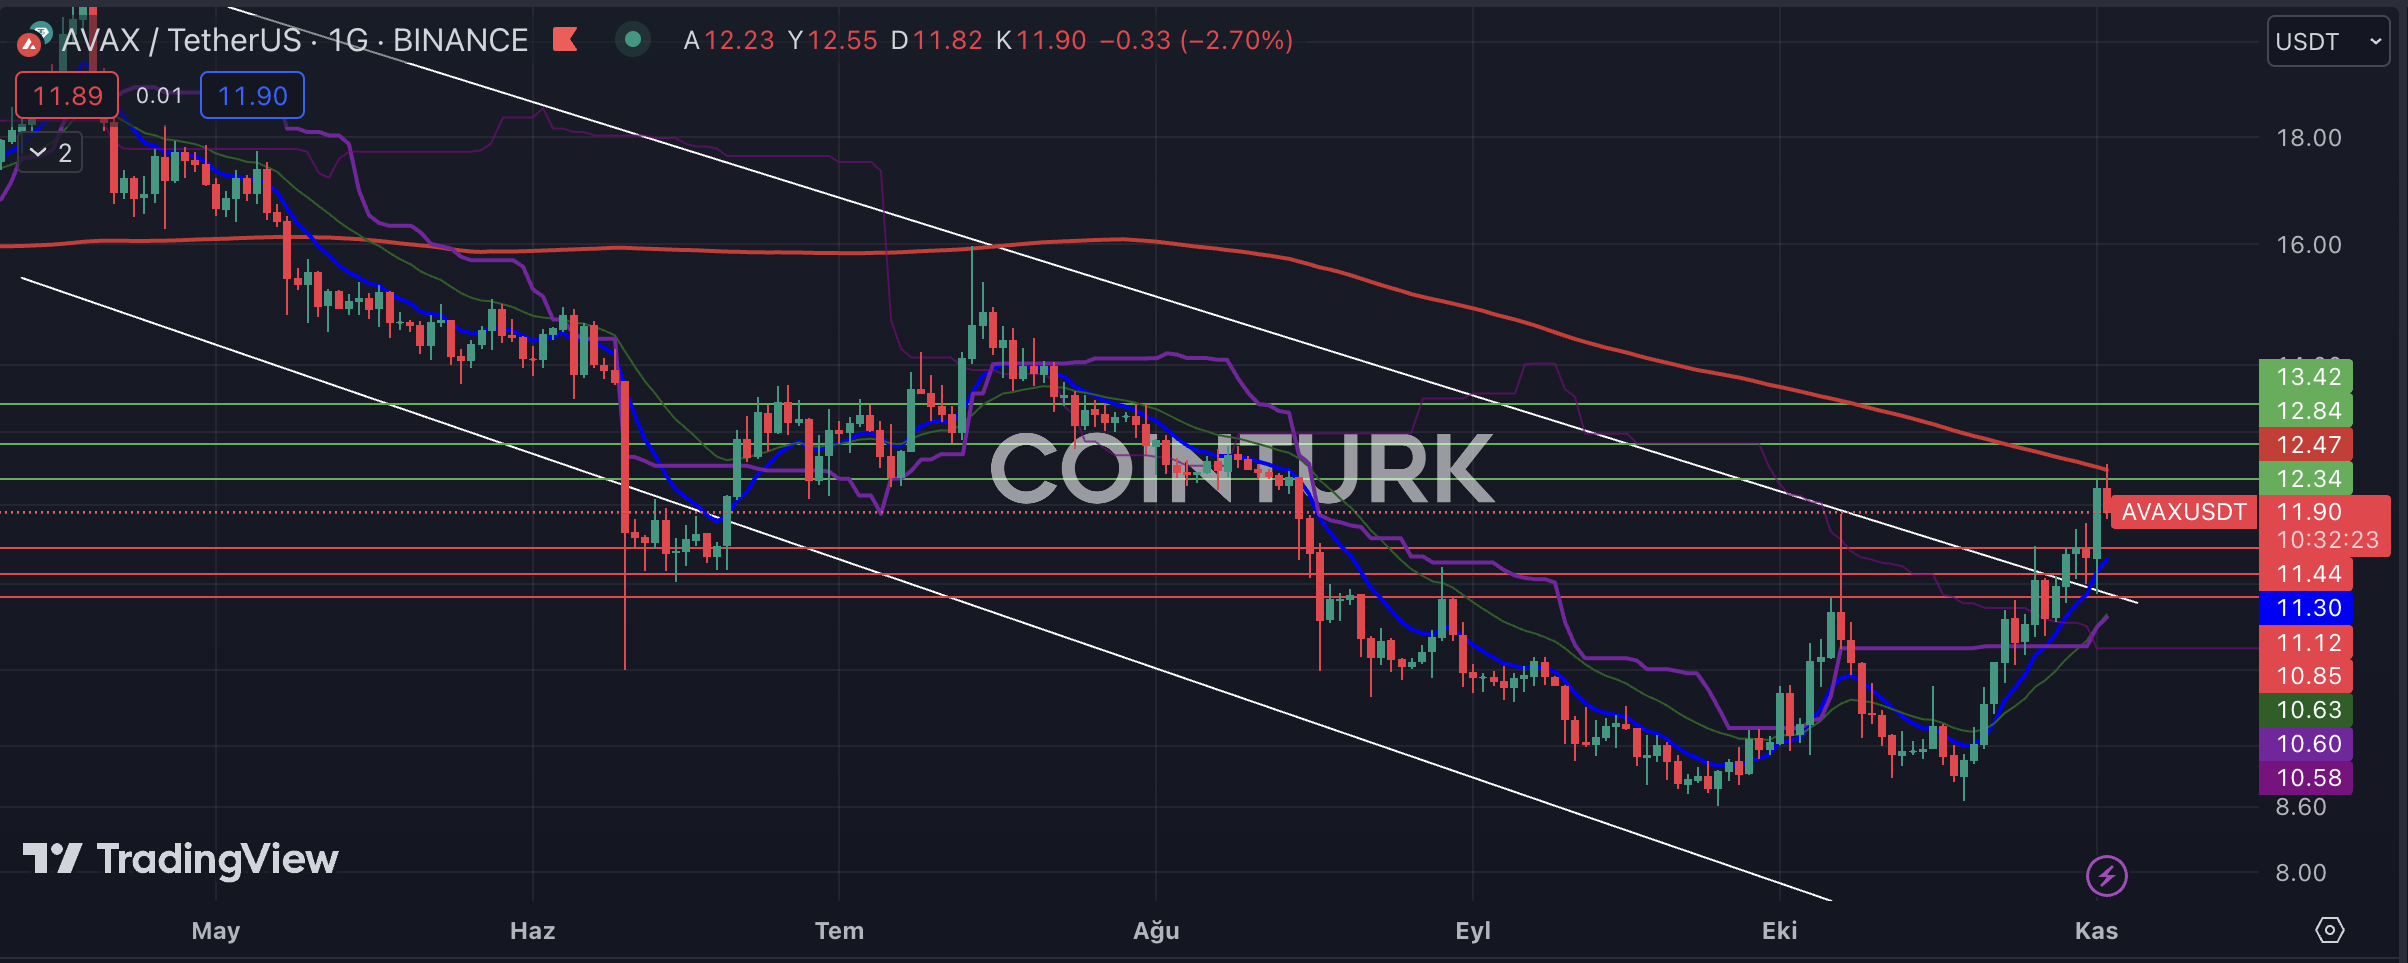
With the recent price increases, Avax has broken the resistance of the long-standing descending channel formation. In particular, the fact that this line has started to act as support after the breakout has increased the likelihood of an uptrend. However, the selling pressure from the EMA 200 level (red line) seen in the last bar is a negative factor for the uptrend scenario.
The support levels that need to be considered for Avax are respectively $11.44, $11.12, and $10.85. In particular, if a daily bar closing below $10.85 occurs, it will lead to a return to the descending channel formation. The resistance levels to be followed for Avax are respectively $12.34, $12.84, and $13.42.
Chiliz Chart Analysis
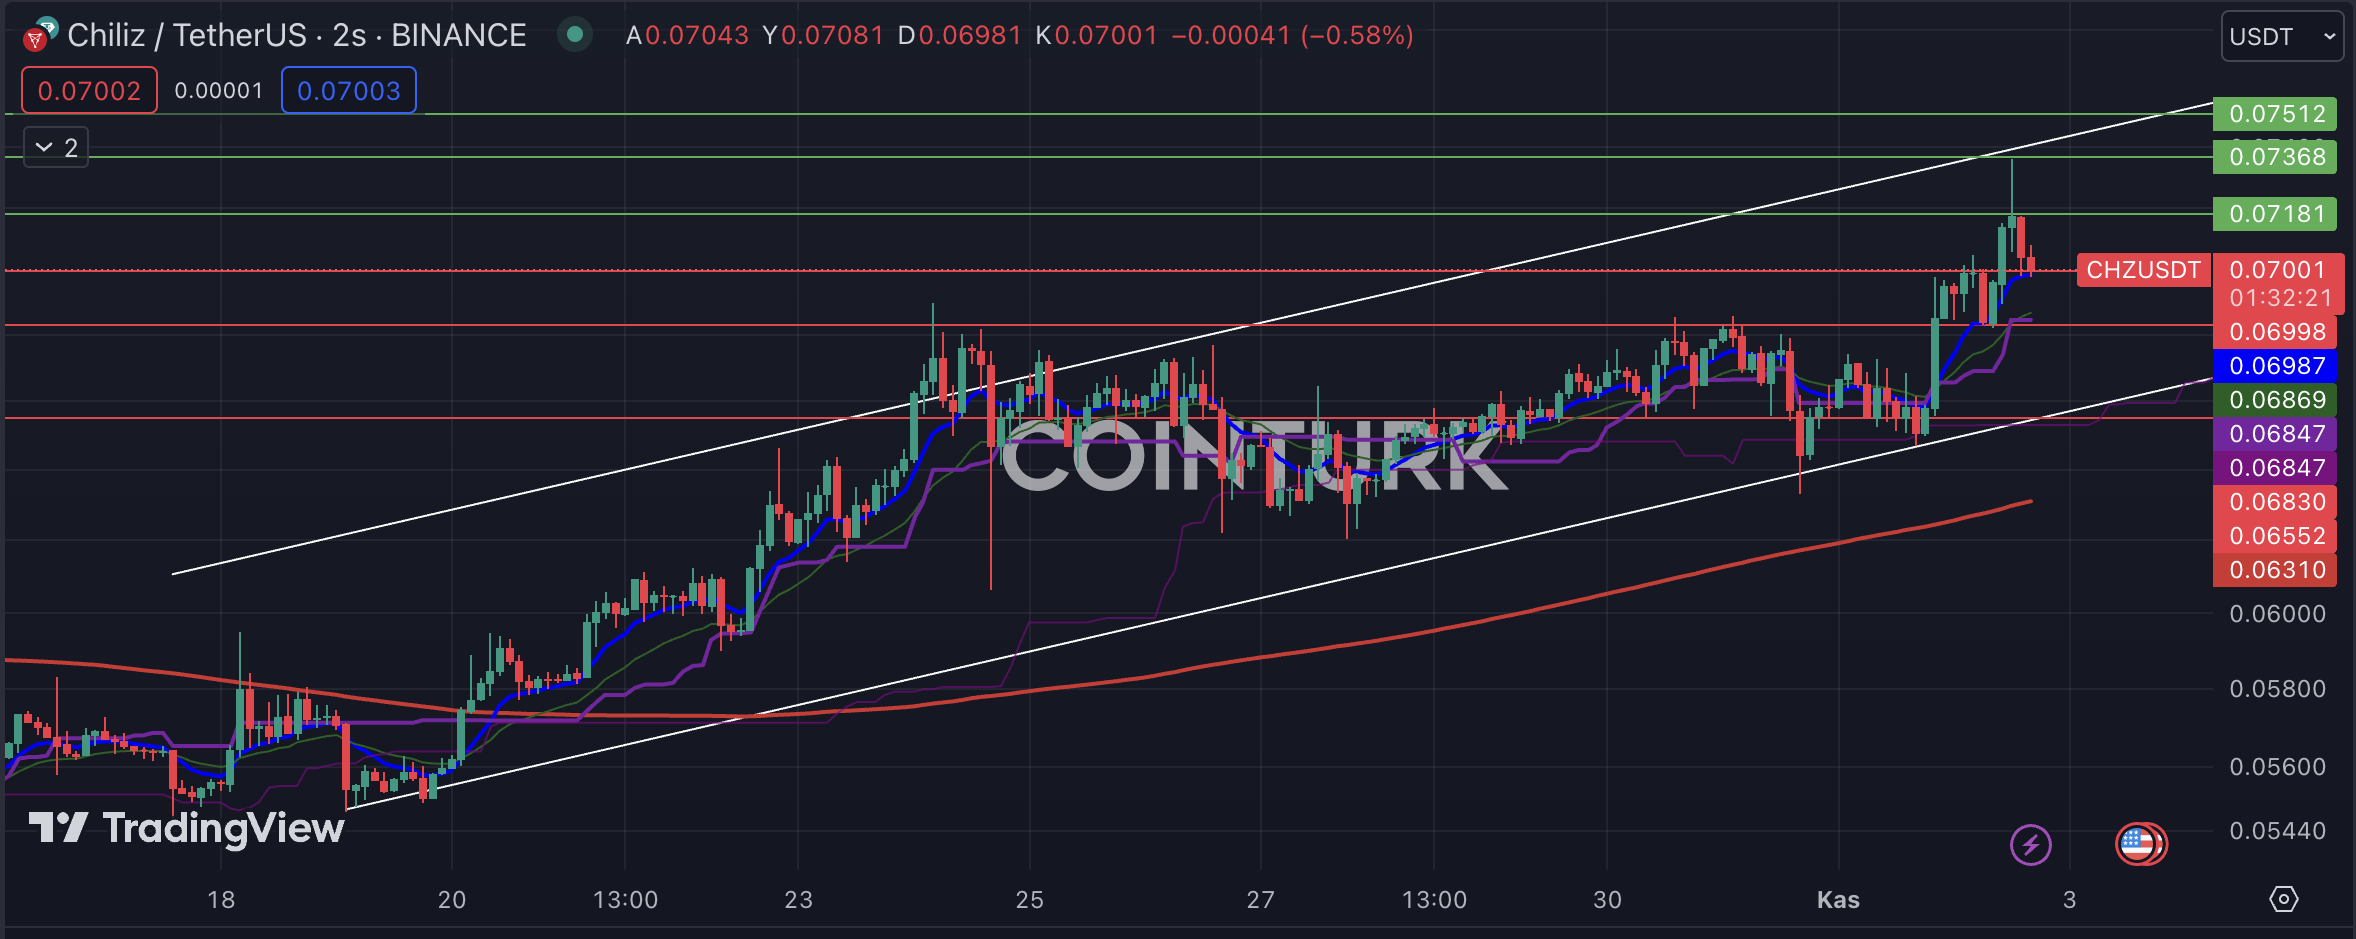
Chiliz, one of the most ambitious altcoin projects among Turkish investors, has been pleasing its investors with its recent chart structure. According to this, the rising channel formation on the two-hour chart stands out. However, investors should be cautious about the selling that follows contact with the resistance line.
The support levels that stand out for Chiliz are respectively $0.06998, $0.06830, and $0.06552. In particular, if a bar closing below $0.06552 occurs, it may disrupt this formation structure. The resistance levels to be followed for Chiliz are respectively $0.07181, $0.07368, and $0.07512.
