The recent surge in the cryptocurrency market has pleased many investors. However, Bitcoin, which has been experiencing an increasing downward trend in the past two days, continues to attract attention. Especially the inability to sustain above the $35,000 level creates a negative situation for Bitcoin. So, what’s happening in the beloved Polygon sector, considering all these developments?
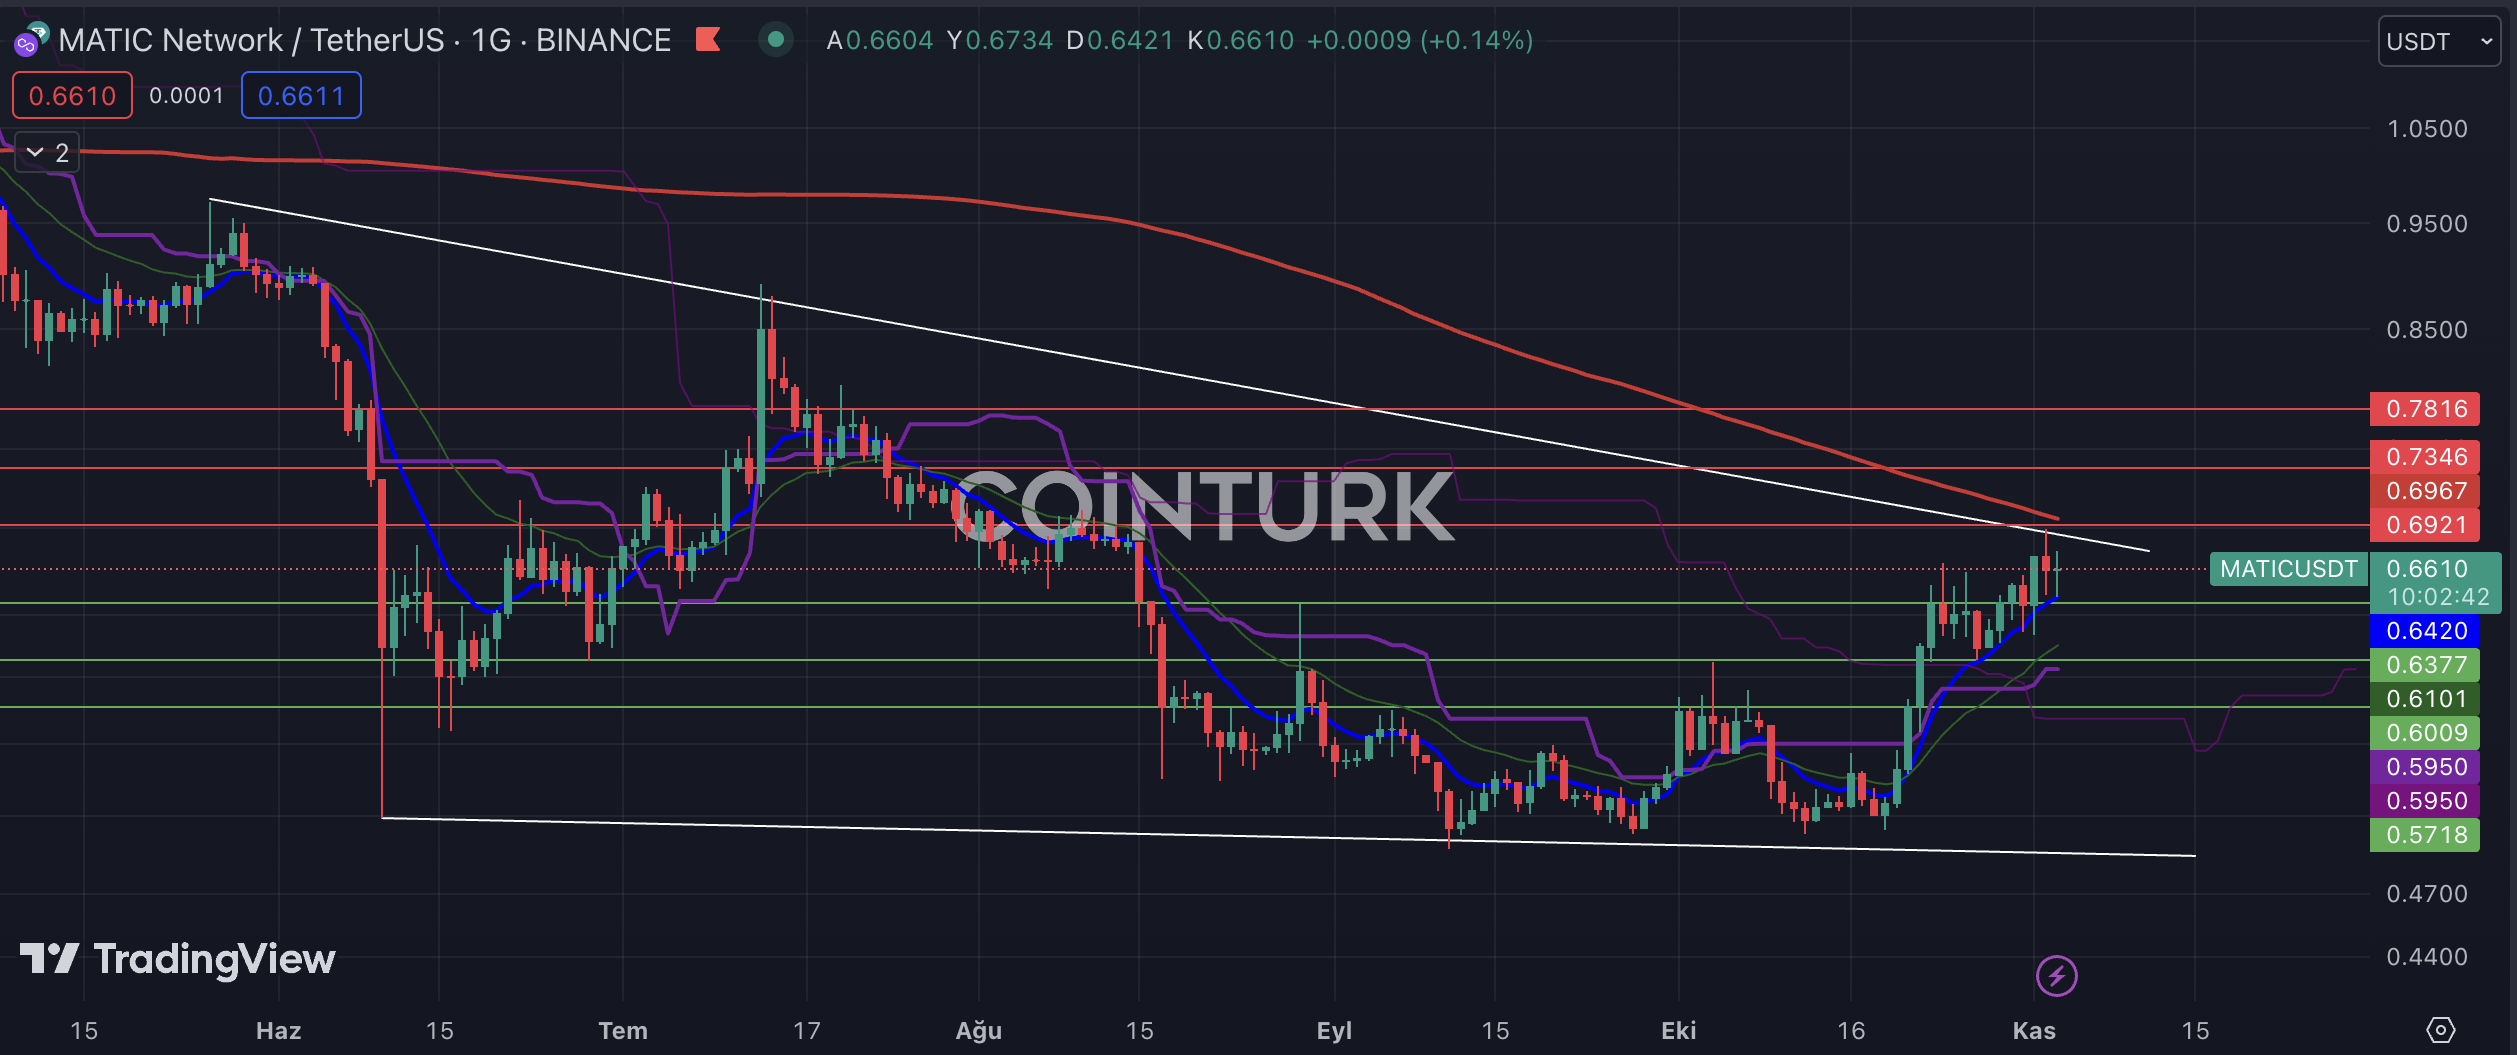
Polygon Chart Analysis
The first notable formation on the daily chart of MATIC is a descending wedge pattern. The fact that this formation occurs after a decline is considered a negative impact in traditional market investment instruments. Additionally, the rejection from both the wedge resistance and the EMA 200 level after the recent rise could sound the alarm bells for MATIC.
The support levels to be considered on the daily chart of MATIC are as follows: $0.6377, $0.06009, and $0.5718. Especially if the daily bar closes below the $0.06009 level, the price may drop below the EMA 7 and EMA 21 averages, leading to the realization of a support touch.
The resistance levels that need to be followed on the daily chart of MATIC are: $0.6921, $0.7346, and $0.7816. In particular, a daily bar closure above the $0.6921 level, intersecting with the EMA 200 (red line), allows the formation structure to work in an upward direction and helps MATIC gain momentum in its rise.
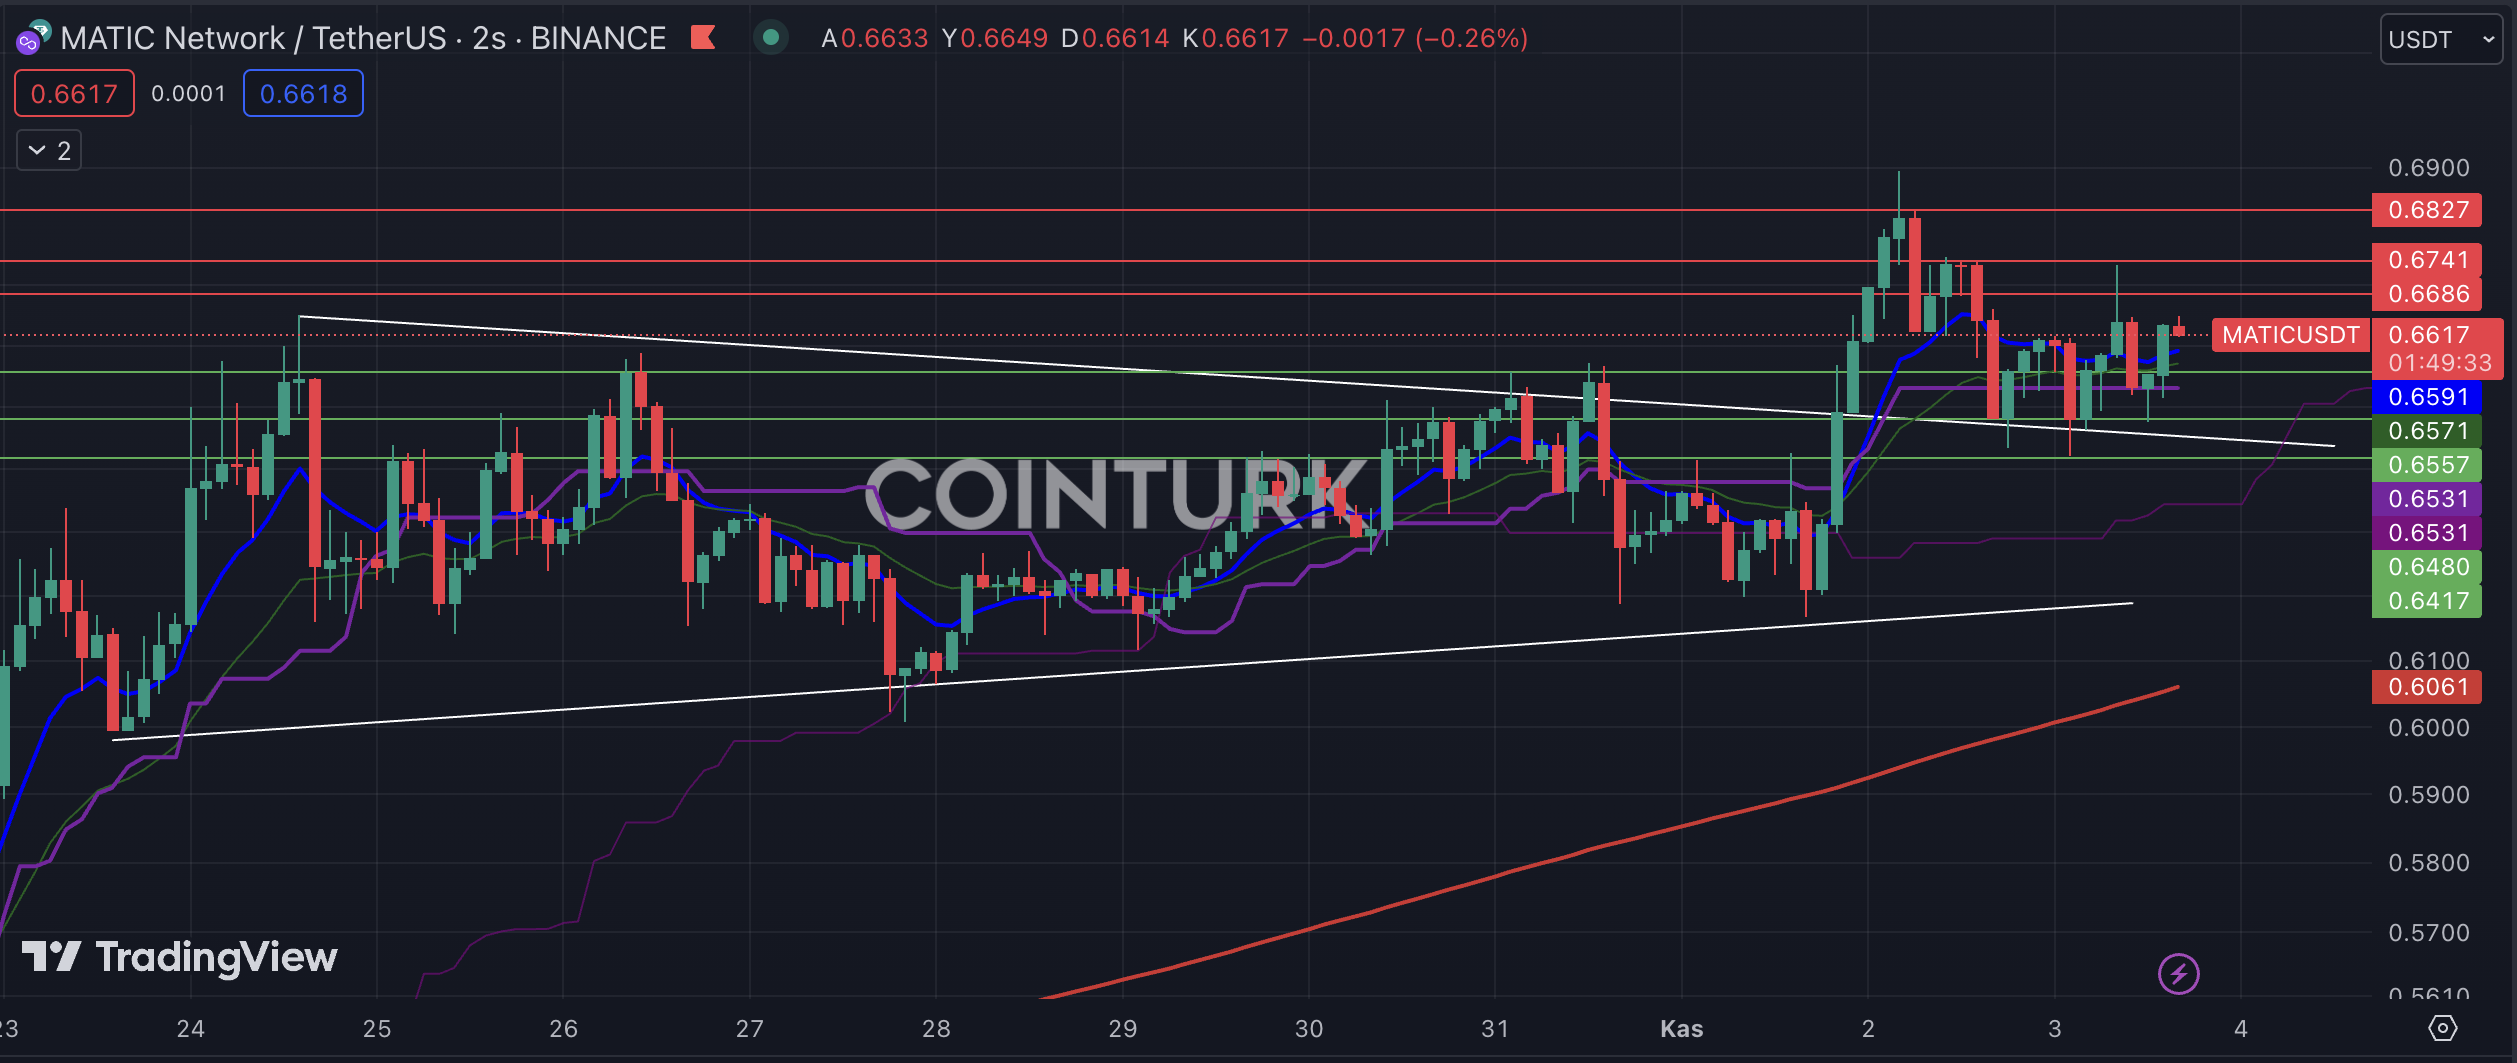
Polygon Two-Hour Chart Analysis
Following the narrowing wedge formation on the two-hour chart, MATIC broke above the resistance line and the formation resistance started to act as support. The fact that resistance turns into support in such breakouts is one of the most important factors that help the price gain strength.
The support levels to be noted on the two-hour chart of MATIC are as follows: $0.6557, $0.6480, and $0.6417. In particular, if a bar closure occurs below the $0.6557 level, the price may return to the formation zone, triggering a short-term decline.
The resistance levels that need to be followed on the two-hour chart for MATIC are: $0.6686, $0.6741, and $0.6827. In particular, if a bar closure above the 0.6827 level, which stands out with a double top in the recent rise, occurs, it could give momentum to MATIC’s upward movement.