In the past two days, we have witnessed a selling pressure in the cryptocurrency market. At the time of writing, Bitcoin is trading at $34,870, and the first target for Bitcoin is to close above $35,000 on a daily basis. The movements in altcoins have also attracted attention under the leadership of Bitcoin. So, what is happening in the meme token market? In this article, we will analyze the charts of SHIB, DOGE, and FLOKI.
SHIB Chart Analysis
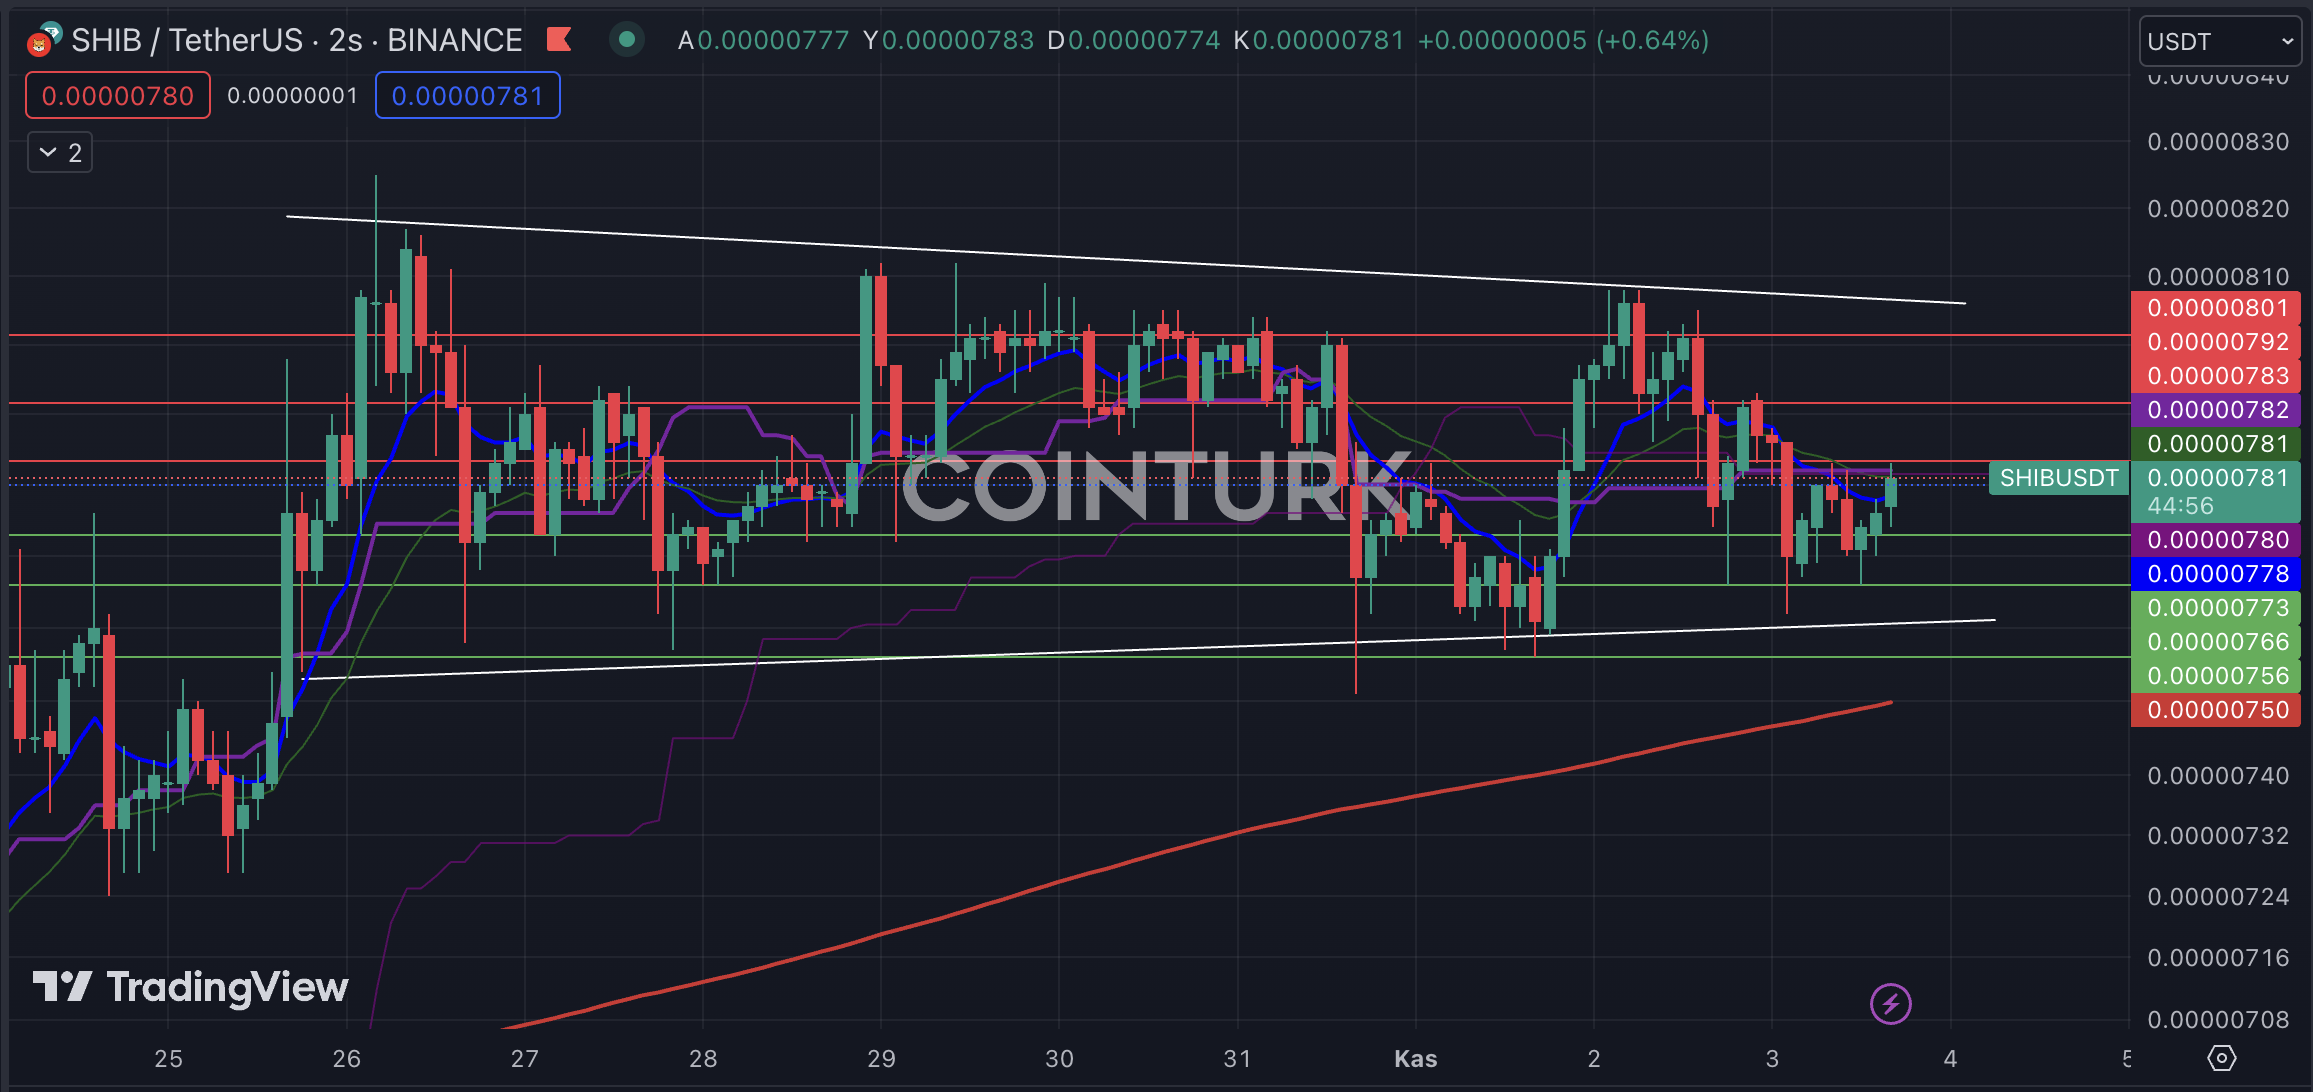
The Shiba Inu team continues to remain silent lately. The lack of any developments in this area, especially since the launch of the Layer-2 project Shibarium, negatively affects the price of SHIB. The wedge formation on the two-hour chart of SHIB can lead to a significant price increase as it formed along with the uptrend.
The support levels to be considered for SHIB are respectively; $0.00000773, $0.00000766, and $0.00000756. Especially, if the closing price falls below $0.00000756, it will disrupt the formation structure and cause the price to drop. The resistance levels to be followed for SHIB are respectively; $0.00000783, $0.00000792, and $0.00000801.

Dogecoin Chart Analysis
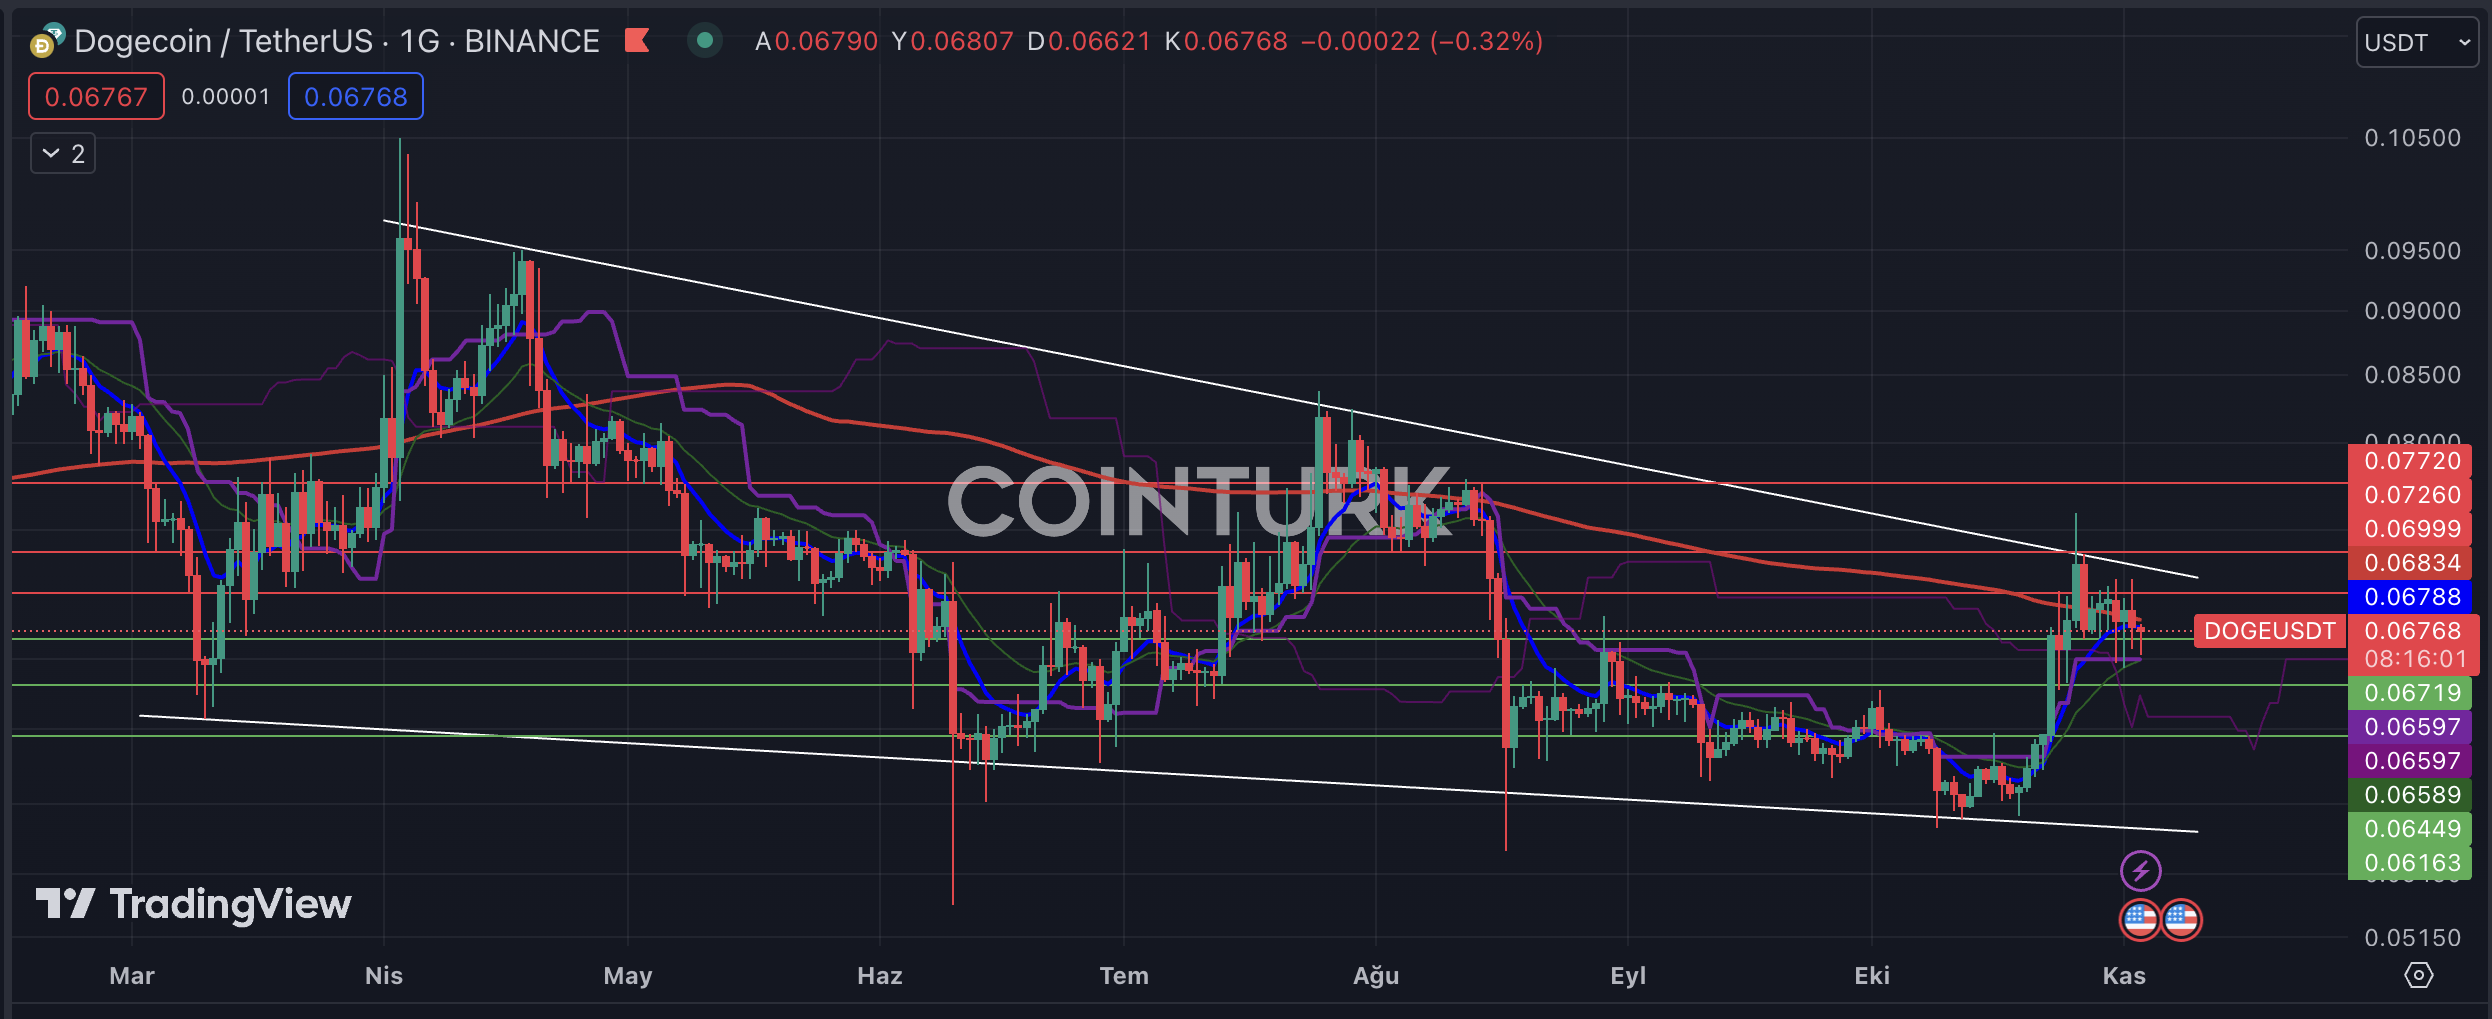
The narrowing wedge formation structure in the DOGE chart since April is noteworthy. Especially, DOGE, which experienced a rise in many periods with Elon Musk’s tweets, cannot reach this level of volatility lately. The pressure of the EMA 200 level (red line) on the price in recent days creates a negative situation for DOGE.
The support levels to be considered for DOGE in the daily chart are respectively; $0.06719, $0.06449, and $0.06163. Especially, if the closing price falls below $0.06449, it may lead to a scenario of decline for DOGE. The resistance levels to be followed for DOGE are respectively; $0.06999, $0.07260, and $0.07720.

FLOKI Chart Analysis
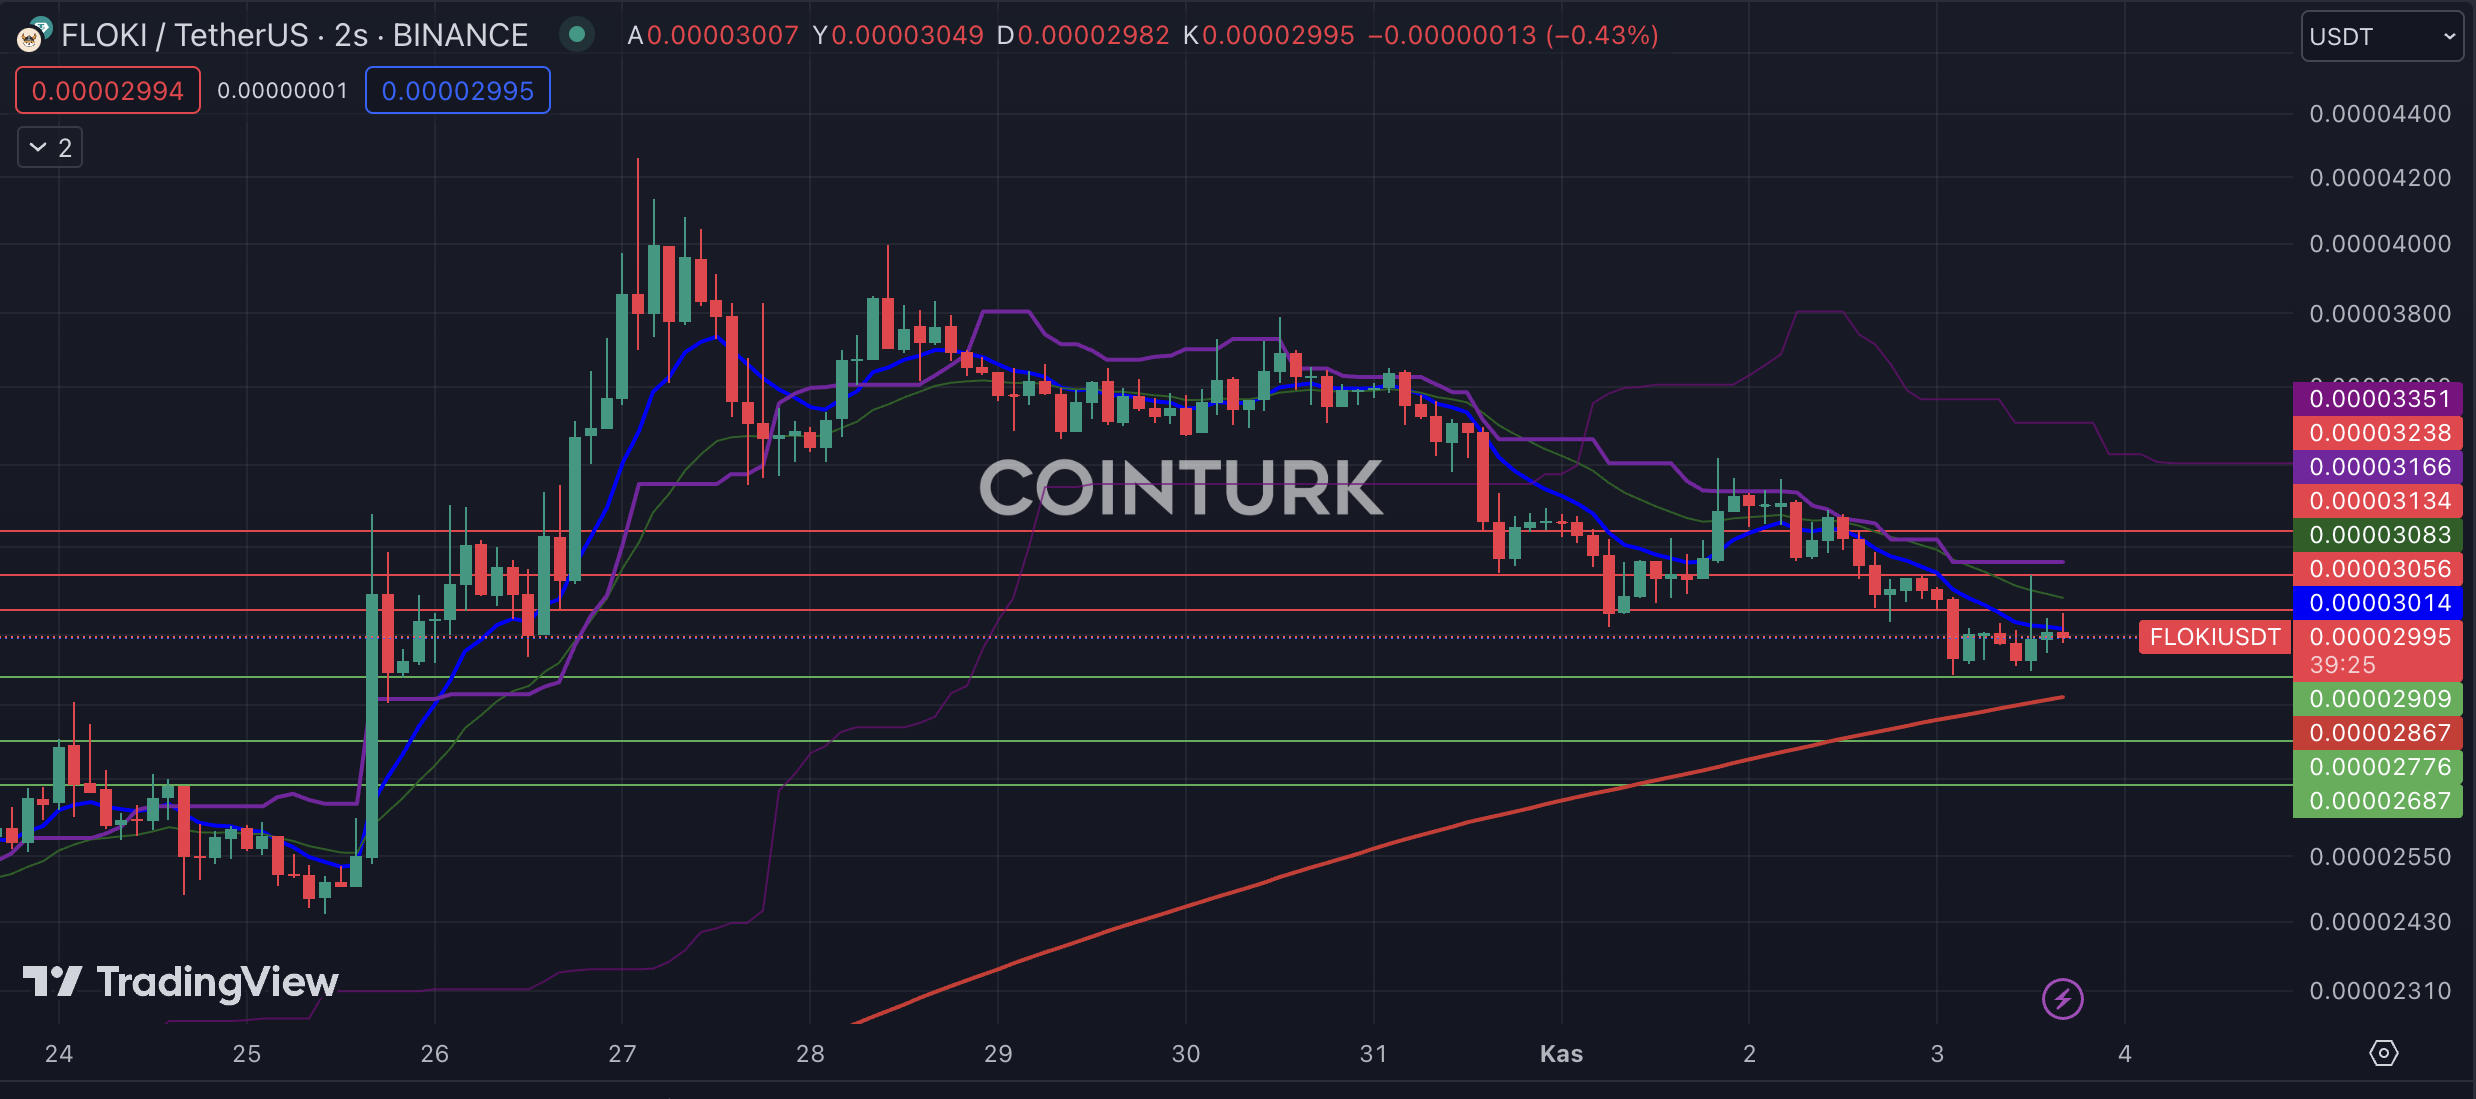
Sales continue in FLOKI after the recent developments. The decline on the two-hour chart is noteworthy as the impact of the news diminishes. For FLOKI, which managed to hold on at the last support level, these areas can be power gaining zones.
The support levels to be considered for FLOKI in the two-hour chart are respectively; $0.00002909, $0.00002776, and $0.00002687. Especially, if the closing price falls below $0.00002776, it will result in the loss of support from the EMA 200 level. The resistance levels to be followed for FLOKI are respectively; $0.00003056, $0.00003134, and $0.00003238.


 Türkçe
 Español


