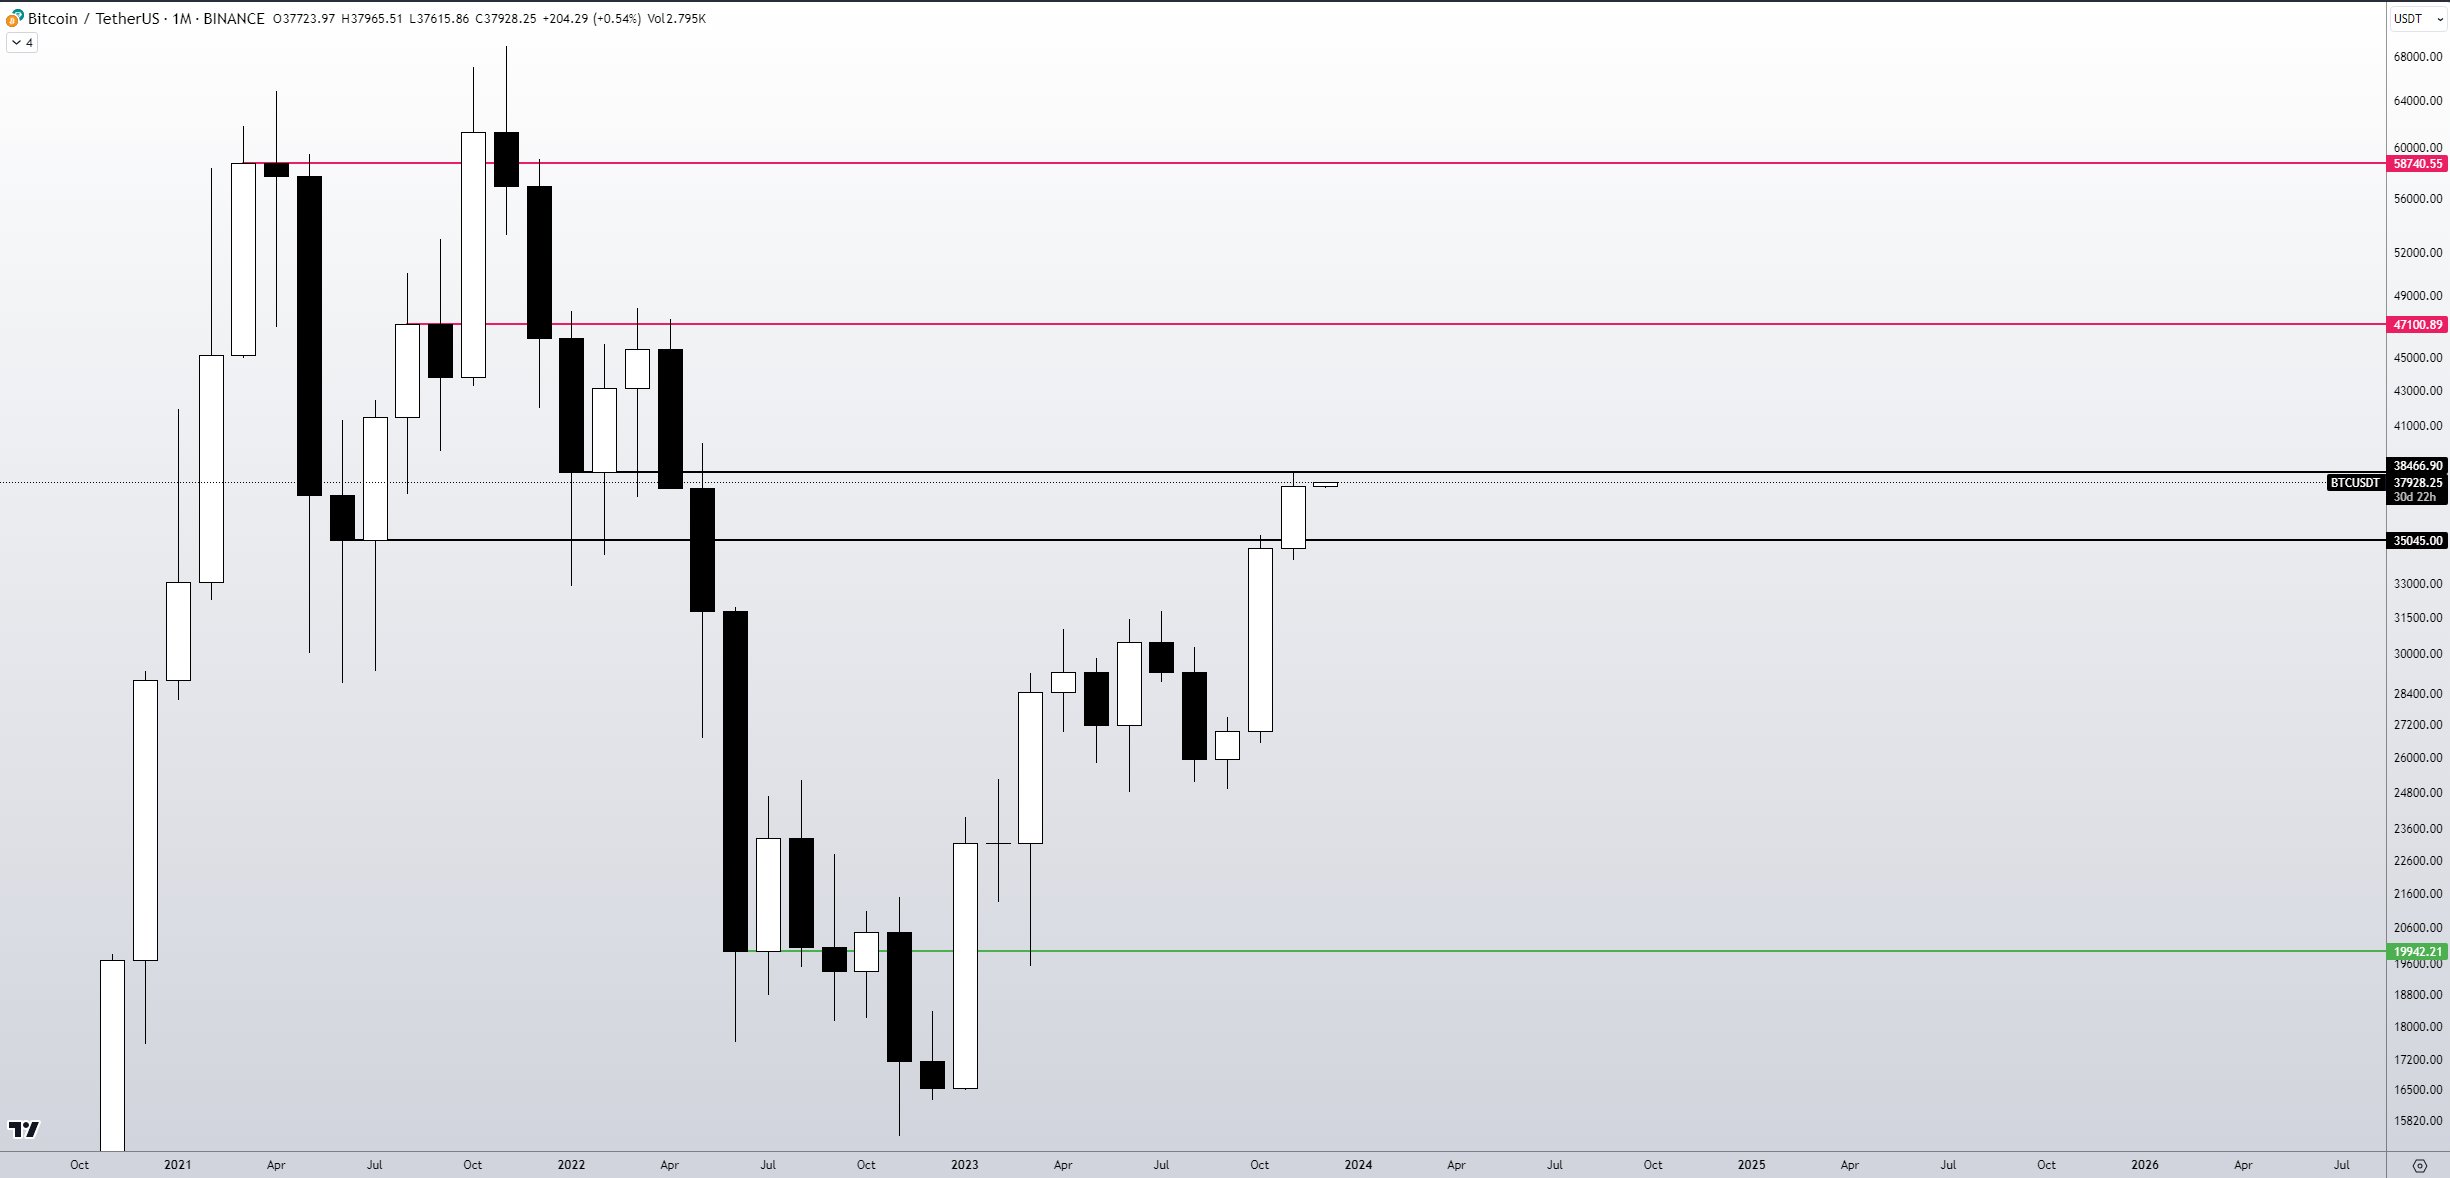
Bitcoin, the largest cryptocurrency, rebounded above the $38,000 level after achieving its best monthly candle close since April 2022. Despite the bears’ efforts, they could not trigger a sell-off before the monthly close. Data indicates that the closing was slightly above $37,700, and order book data from Material Indicators suggests that the offer liquidity maintained its intraday range, avoiding a last-minute sale.
What’s Next for Bitcoin?
Renowned crypto analyst Skew evaluated Bitcoin’s monthly close on his personal X (formerly known as Twitter) account. The analyst said, “A monthly close above $35,000 looks quite good,” and added that the crypto king could consolidate in the $35,000 to $39,000 range for a few weeks.

Skew pointed out that the main resistance in the monthly time frames is now at higher levels, with the first significant resistance at $47,000 and resistance beyond that around the all-time high of $69,000 recorded in 2021.
Another crypto analyst, JT, commented on the monthly close, saying, “The monthly candle was perfect with a low candle body of $34,500; this is quite significant as the low candle body is higher than the previous high candle body. This is a sign of strength.” JT also noted, “Let’s not forget that this month closed $3,000 higher than the previous month, which is progress.” The analyst also emphasized that Bitcoin’s high timeframe price chart looks consistent and constructive.
Bitcoin’s Price Range Has a Significant Direction
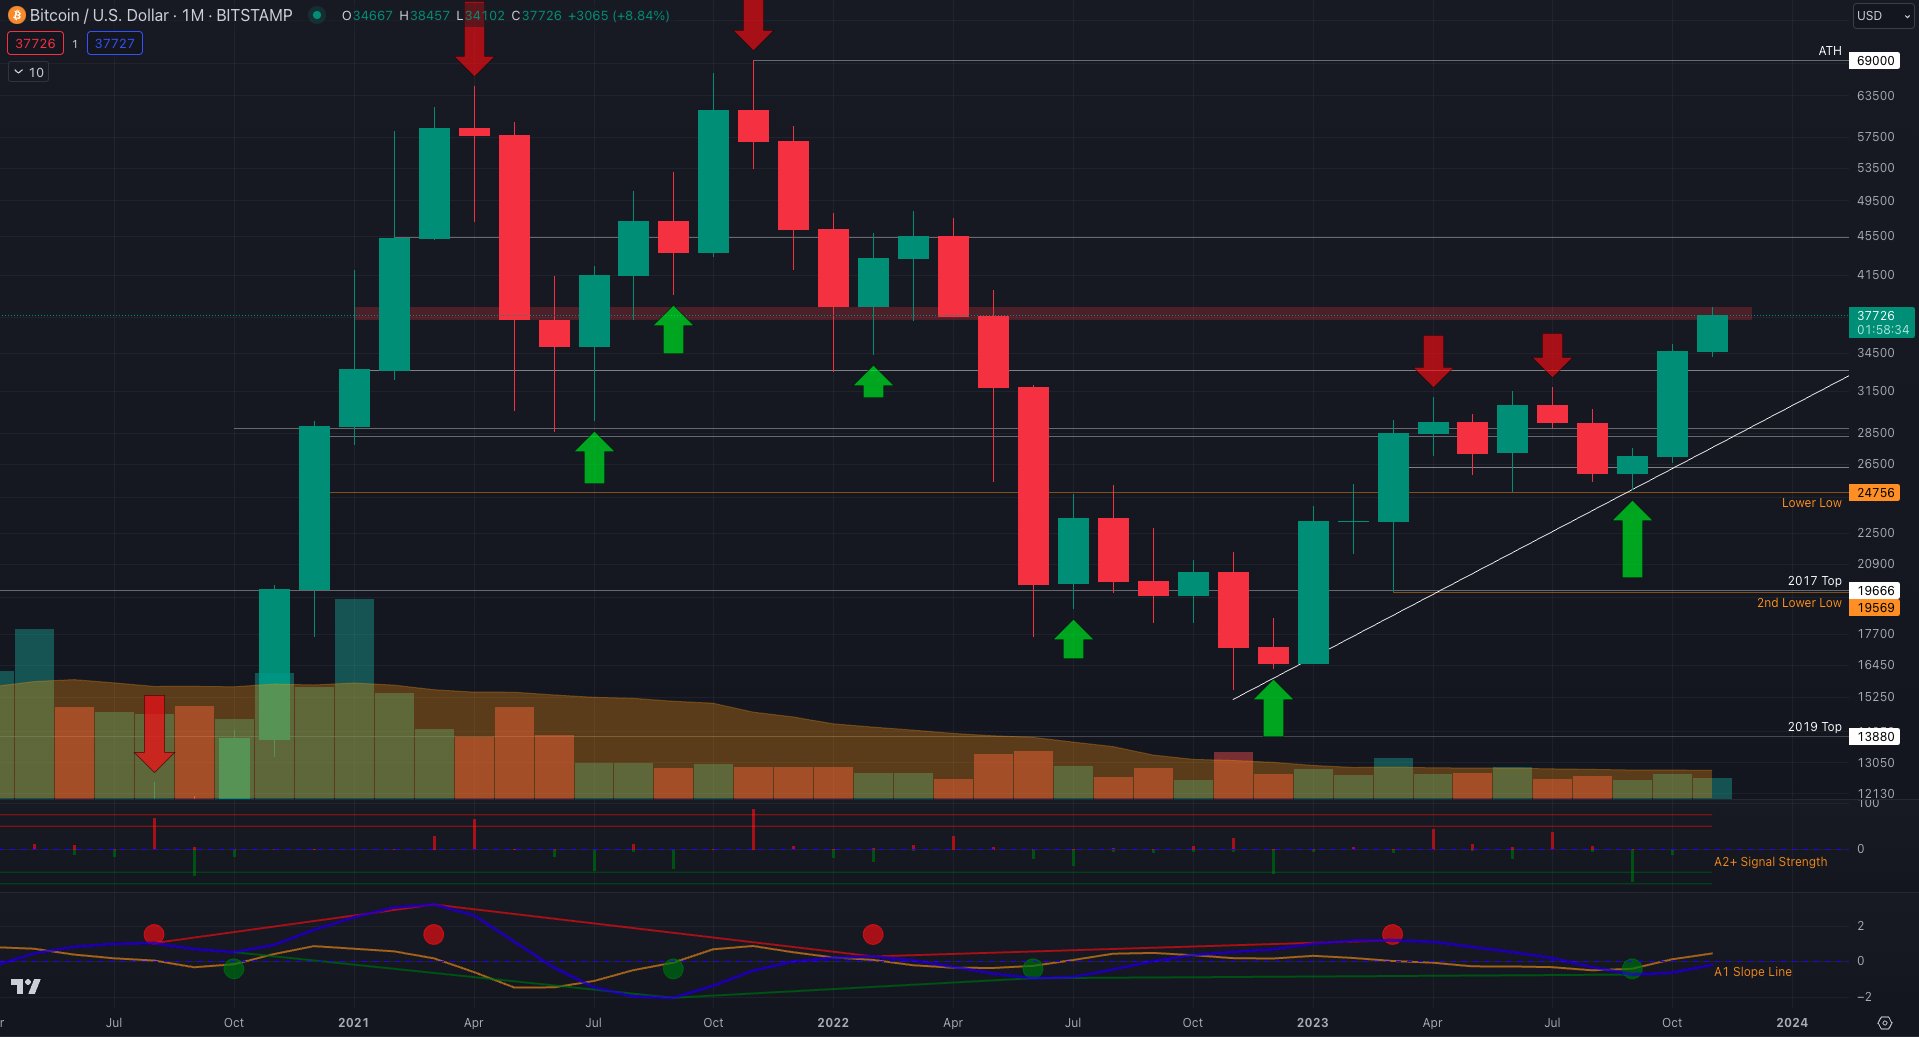
Keith Alan, the co-founder of Material Indicators, highlighted the stubborn nature of the current range below $40,000, arguing that clearing this range of sellers is extremely important. Alan referred to the historical resistance/support (R/S) lines in play within the range. These support/resistance lines are as significant as those already cleared, such as the all-time high of around $20,000 recorded in 2017.
Alan elaborated on his assessment by noting, “If you think BTC is wandering around an arbitrary price, you are mistaken. There is a significant crowd in this small R/S range.”

Alan also shared a chart, indicating the levels to watch on the monthly chart with long and short signals from one of Material Indicators’ proprietary trading indicators.


