Polygon (MATIC) price was unable to break out of its long-term decreasing resistance trend line last week, forming a lower peak in the process. Despite this, it continues to trade above the horizontal support area. So, is the MATIC price ready to leap, or is the path to a decline now open?
Attempted Breakout in MATIC
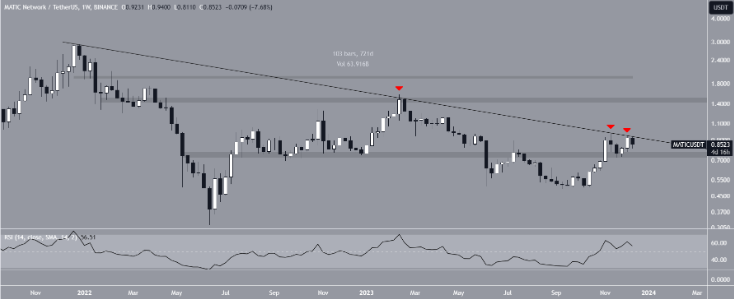
When examining the weekly time frame technical analysis, it is apparent that the MATIC price has been trading below a decreasing resistance trend line since the All-Time High (ATH) level it reached in December 2021. This decline paved the way for a low of $0.32 in June 2022. MATIC then started an upward price movement. To date, there have been three unsuccessful attempts to break the resistance trend line (red symbols) including last week. A longer-term review reveals that the long-term trend line has remained in place over a 720-day period.

Additionally, the graph indicates an increase in the Relative Strength Index (RSI), and an RSI observed above 50 can be considered a bullish indicator for MATIC.
What Are Analysts Saying?
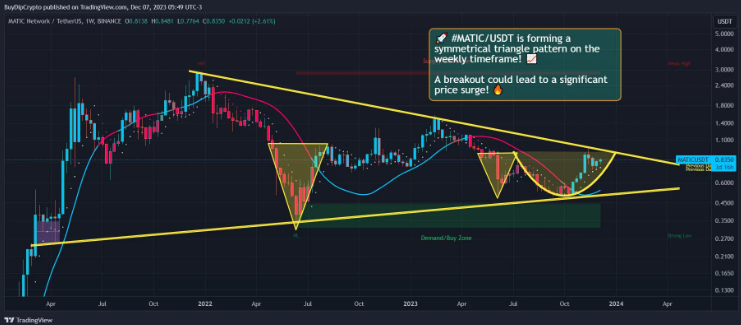
Cryptocurrency traders and analysts, continuing their posts on platform X, seem to have a mostly positive outlook regarding future price movements. Buy Dip Crypto predicts that a parabolic rise may only begin once the long-term resistance trend line is broken, sharing the graph below in support of this view.

Masha mentioned that the rise is due to fundamental reasons. Despite the price drop, the total amount of MATIC staked has increased, and Masha maintains her belief, adding:
“Initially, from the first quarter onwards, both token price and network stake show a positive trend, indicating a developing ecosystem with increasing market value and participation levels. However, a change occurs in the third quarter, where the drop in token price surprisingly supports the growth of staking. This situation shows that network’s stake ecosystem maintains a positive outlook amid market challenges, indicating ongoing participant confidence.”
MATIC Price Prediction
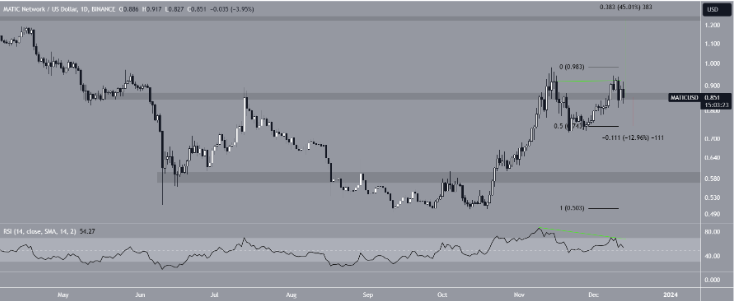
While an upward trend is observed in the weekly charts, the daily timeframe analysis still shows a downward outlook, with price movement and RSI indicator being pointed to as reasons. The price movement indicates that MATIC returned to the $0.85 horizontal area after breaking out. To date, there have been only two deviations above this level.
Additionally, the recent highs show a downward trend in the daily RSI. This is often a sign that appears before a reversal of the downward trend. If MATIC price closes below $0.85, a 13% drop to the $0.74 horizontal support area could be possible. Conversely, a return to the $0.85 area could bring a 45% increase to the next resistance at $1.25.


