COINTURK NEWSCOINTURK NEWSCOINTURK NEWS
  • Real-Time News Feed
  • Bitcoin
  • Altcoin
  • Ethereum
  • Technology News
  • Advertise
  • Contact
  • TURTURTUR
  • ESESES
Search
© 2024 COINTURK NEWS. All Rights Reserved.
Reading: Dogecoin Technical Analysis Overview
Share
Languages
  • TürkçeTürkçe
  • EspañolEspañol
Font ResizerAa
COINTURK NEWSCOINTURK NEWS
Font ResizerAa
Search
  • Real-Time News Feed
  • Bitcoin
  • Altcoin
  • Ethereum
  • Technology News
  • Advertise
  • Contact
  • TURTURTUR
  • ESESES
Follow US
© 2025 BLOCKCHAIN Information Technologies. >> COINTURK NEWS
Powered by LK SOFTWARE
COINTURK NEWS > Dogecoin (DOGE) > Dogecoin Technical Analysis Overview
Dogecoin (DOGE)

Dogecoin Technical Analysis Overview

In Brief

  • Technical analysis is crucial for crypto futures traders.

  • Dogecoin shows a rising channel formation on the four-hour chart.

  • Weekly analysis reveals Dogecoin's strength after resistance breakout.

COINTURK NEWS
COINTURK NEWS 1 year ago
Share
SHARE

In the cryptocurrency market, technical analysis emerges as an indicator that investors, especially those in the futures market, must continuously monitor. So, what clues does the technical analysis provide for Dogecoin, which was trading at $0.09408 at the time the article was written? We examine it in detail, along with the important support and resistance levels.

Contents
Dogecoin Chart AnalysisDogecoin Weekly Chart Analysis

Dogecoin Chart Analysis

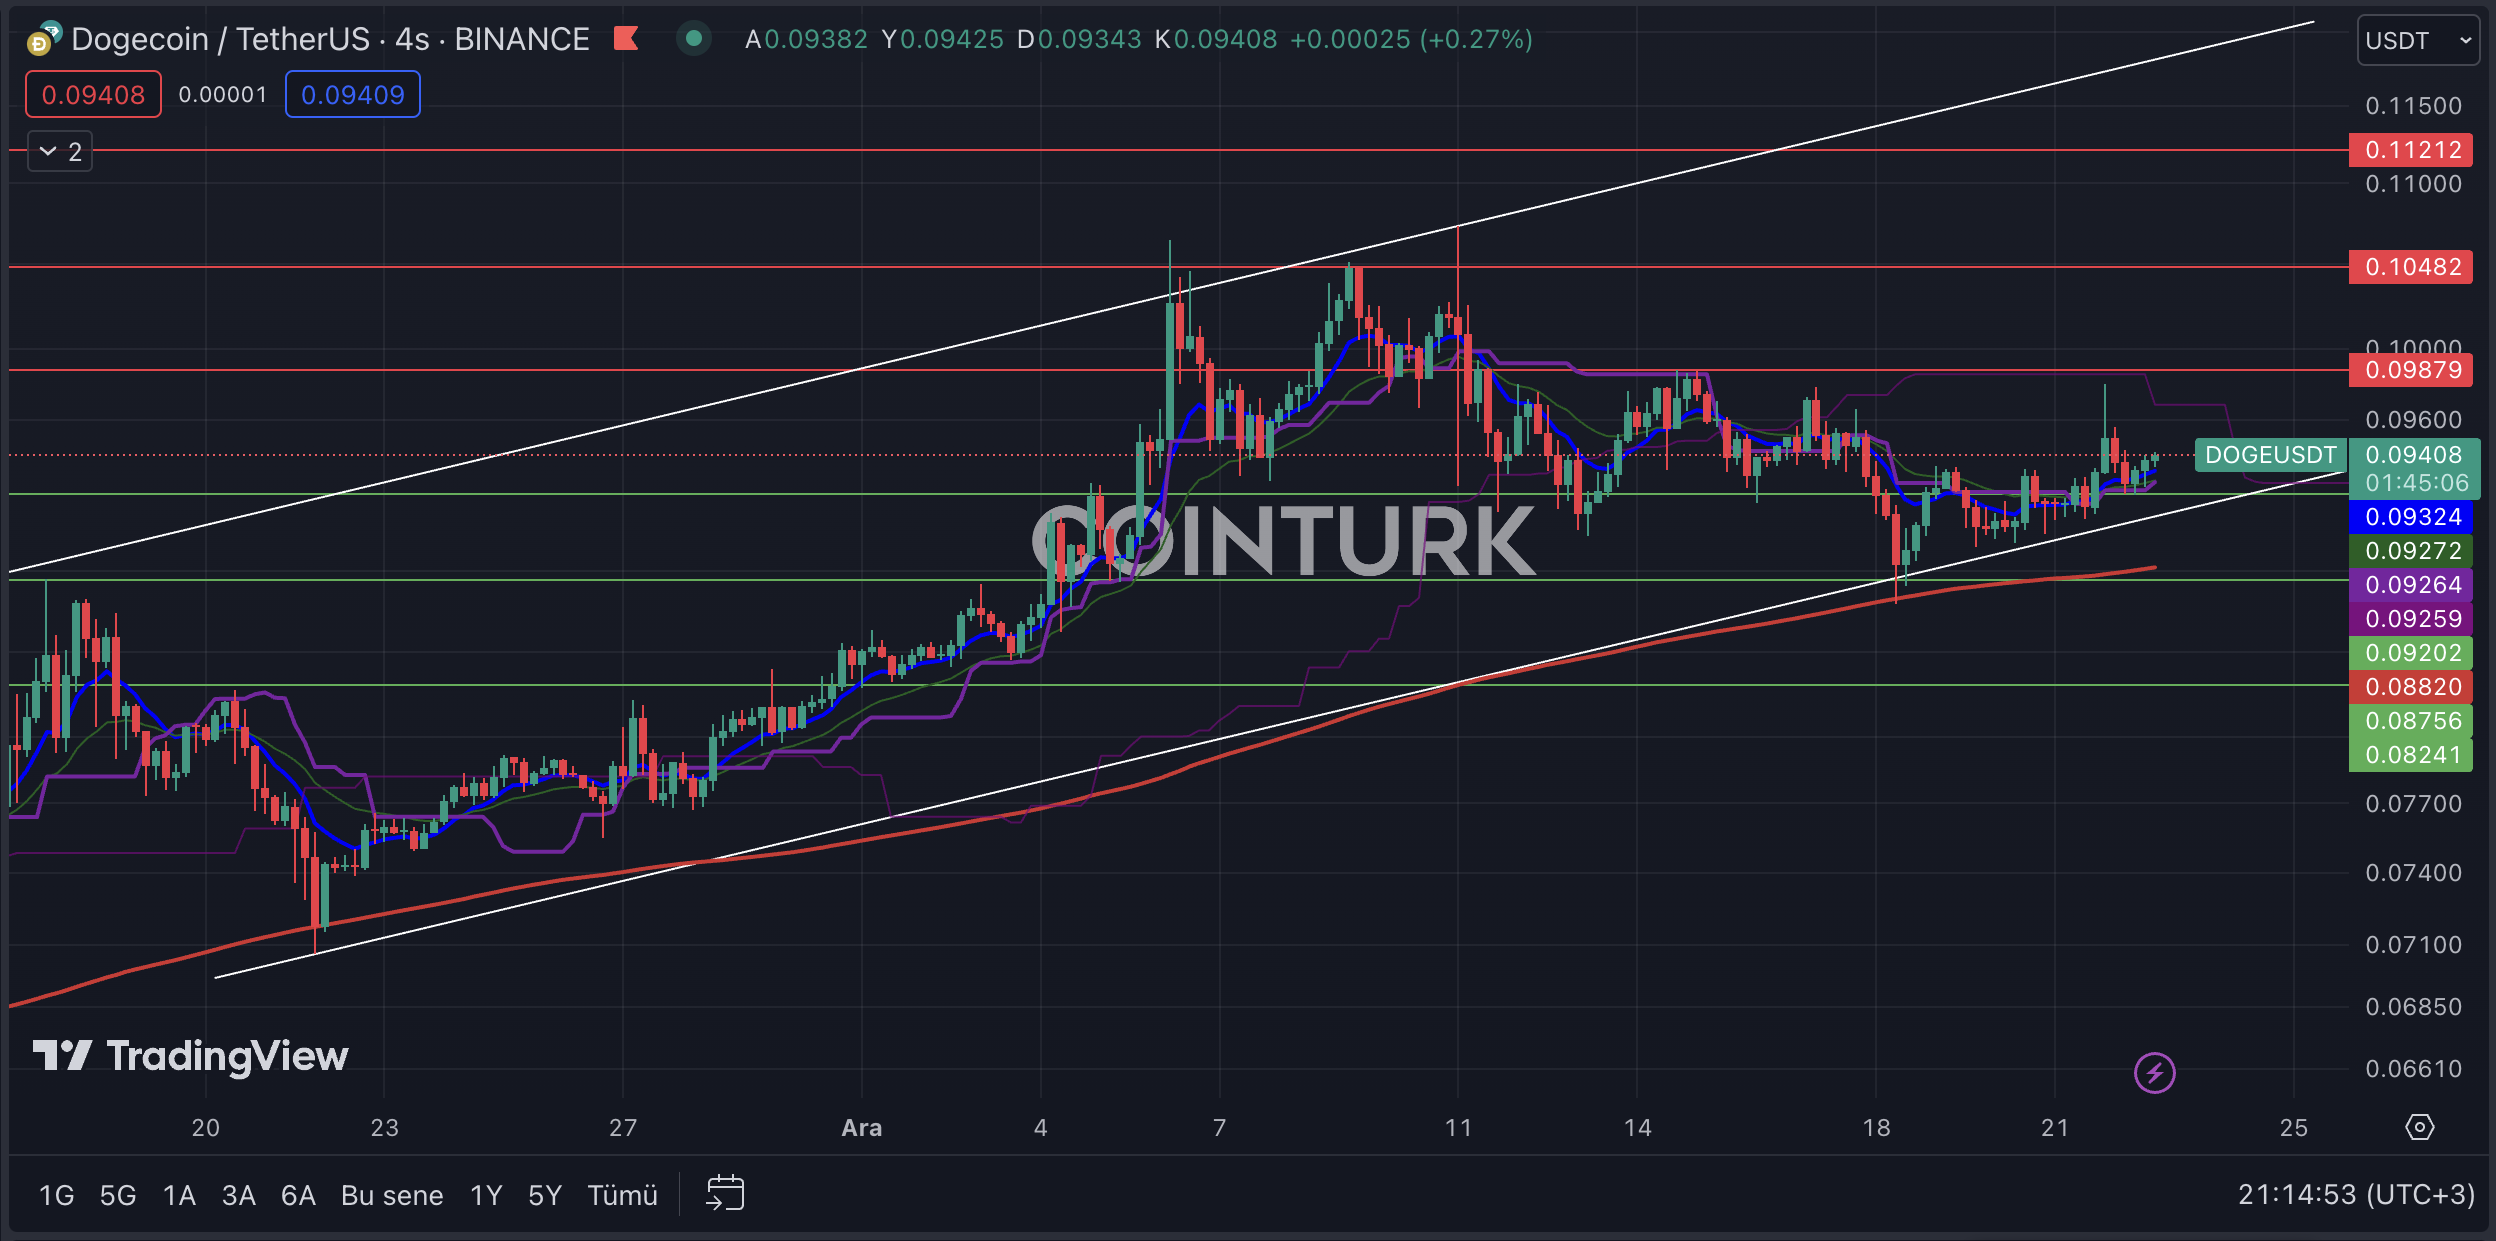
The four-hour Dogecoin chart highlights a rising channel formation. The absence of a support or resistance breakout in the formation structure provides an important clue, especially for futures traders. The intersection of the support line with the EMA 200 (red line) suggests a positive scenario for the price of Dogecoin.

The most important support levels to watch on the Dogecoin chart are; $0.09202, $0.08756, and $0.08241, respectively. Particularly, a four-hour bar closing below the $0.08756 level, which intersects both the formation support line and the EMA 200 level, will cause significant selling pressure on the Dogecoin price.

The most important resistance levels to watch on the Dogecoin chart are; $0.09879, $0.10482, and $0.11212, respectively. Especially, a four-hour bar closing above the $0.09879 level, which has been a significant barrier since December 11, will accelerate the momentum of the Dogecoin price.

Dogecoin Weekly Chart Analysis

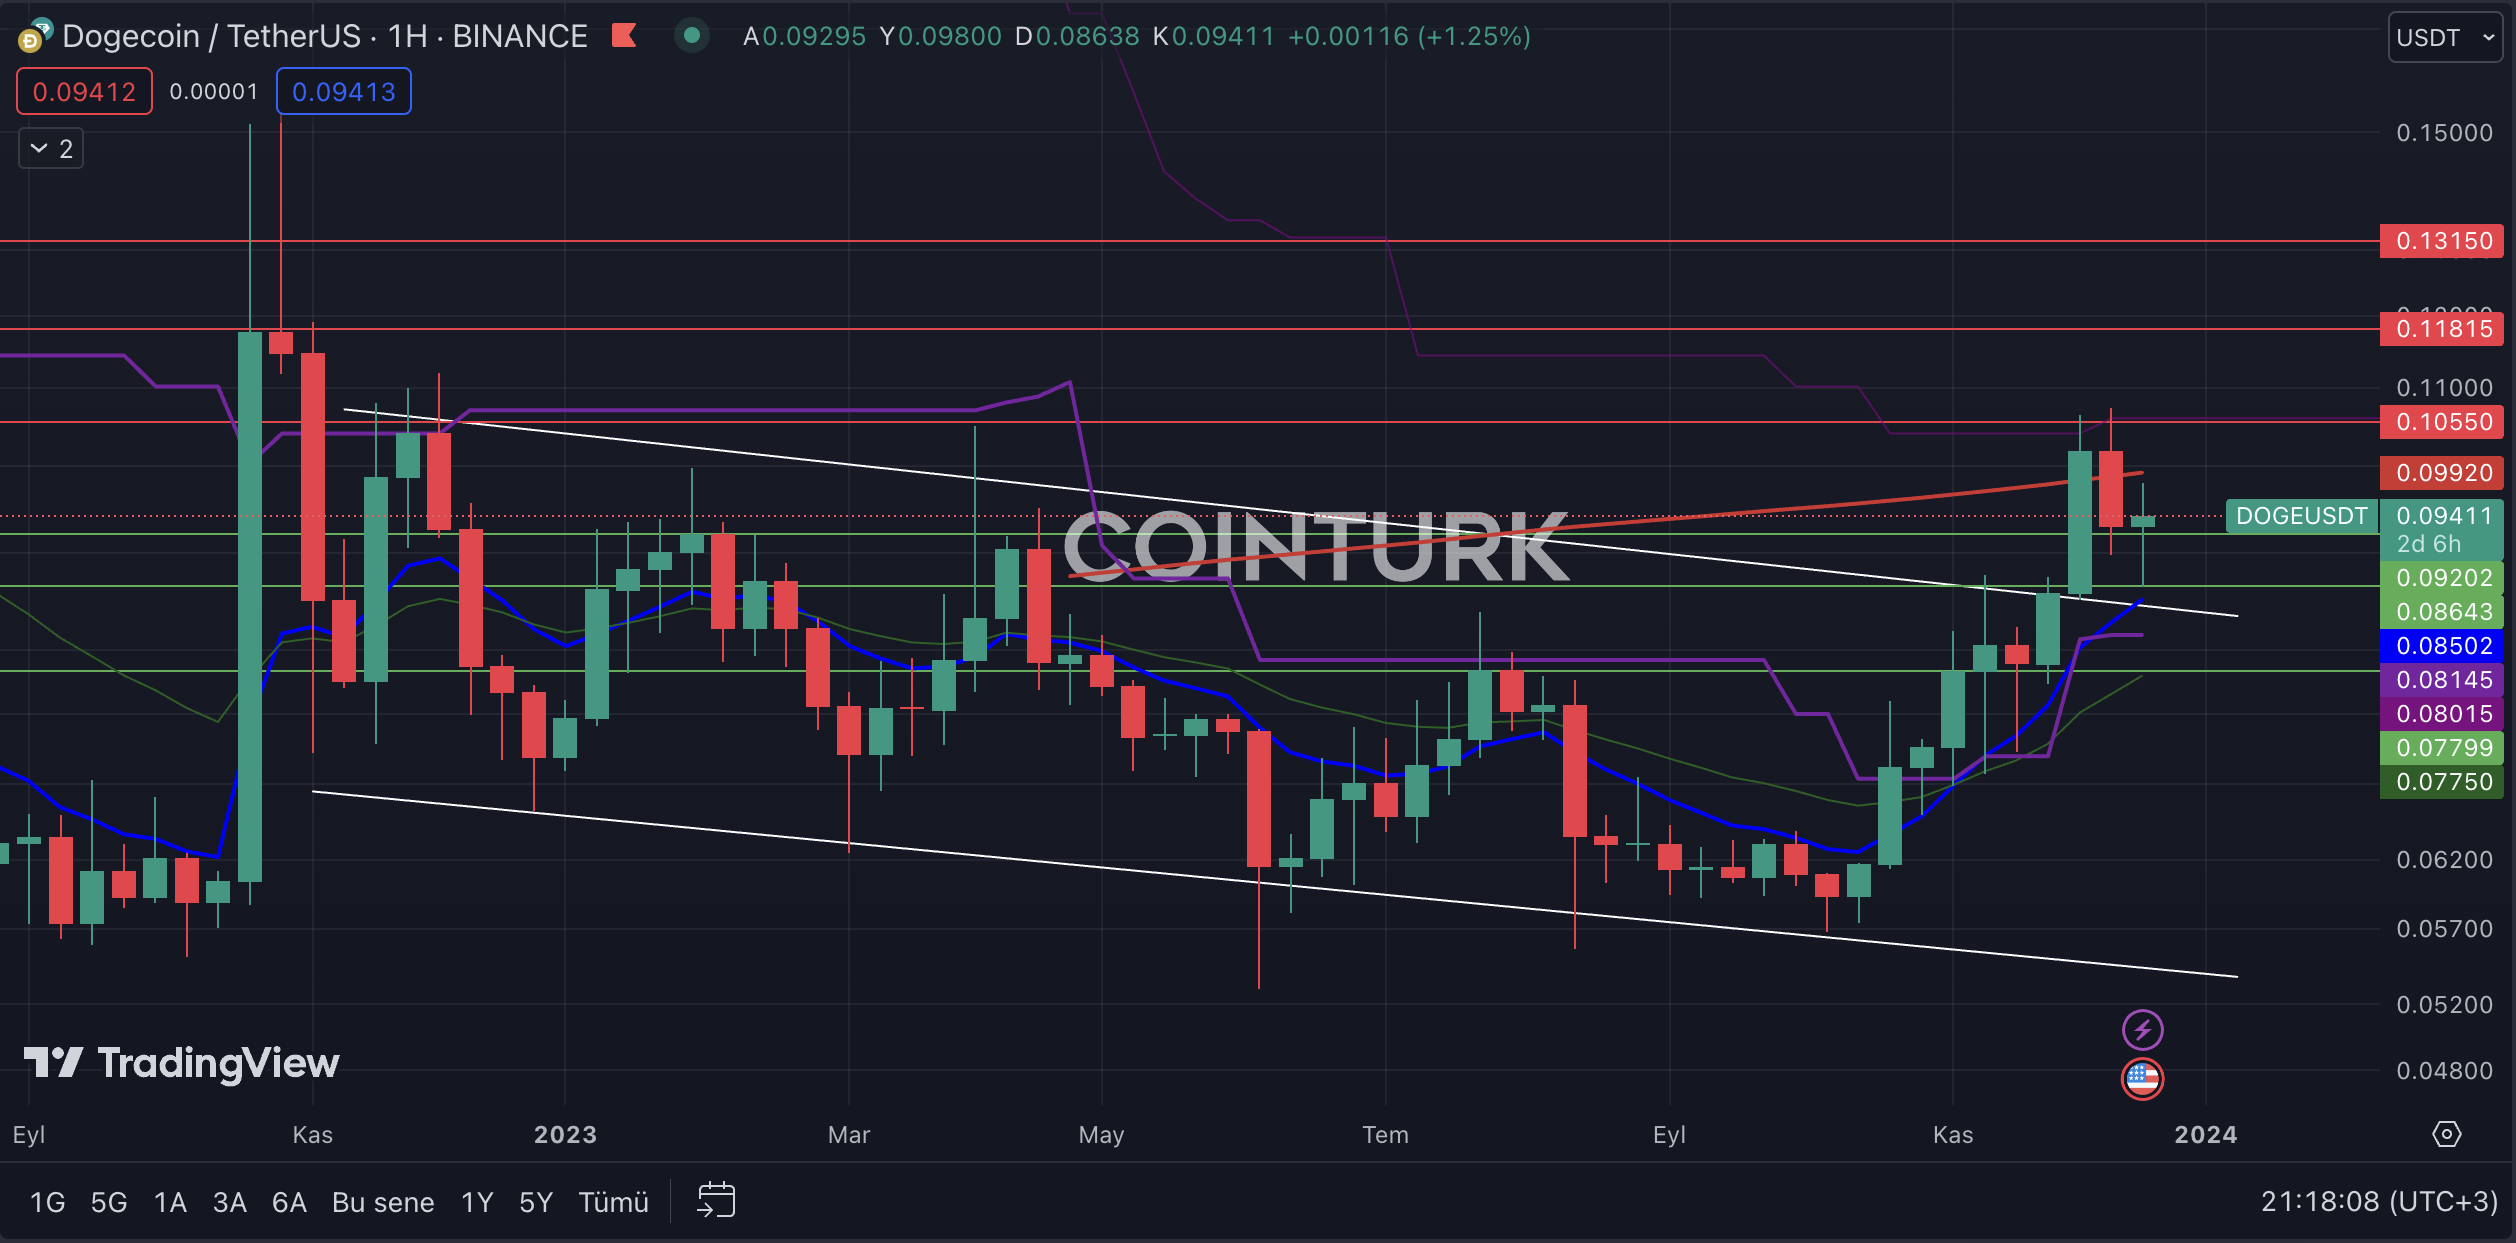
The first notable formation structure in the Dogecoin weekly chart analysis is a descending channel formation. This formation structure successfully completed a resistance breakout in recent weeks, and since then, the Dogecoin price has continued to gain strength. Particularly, the resistance line acting as support reflects a positive process for Dogecoin.

The most important support levels to watch on the Dogecoin weekly chart are; $0.09202, $0.08643, and $0.07799, respectively. Especially, a weekly bar closing below the $0.08643 level, which intersects with the resistance line, could lead to selling pressure on the Dogecoin price.

The most important resistance levels to watch on the Dogecoin weekly chart are; $0.10550, $0.11815, and $0.13150, respectively. Especially, a weekly bar closing above the $0.10550 level, which has been a significant barrier for the last two weeks, will accelerate the momentum of the Dogecoin price.

You can follow our news on Telegram, Facebook, Twitter & Coinmarketcap
Disclaimer: The information contained in this article does not constitute investment advice. Investors should be aware that cryptocurrencies carry high volatility and therefore risk, and should conduct their own research.

You Might Also Like

Dive into Dogecoin’s Thrilling Market Movements

Dogecoin Thrives as On-Chain Activities Soar

Whale Activity Surges as Dogecoin Records Massive Purchases

Dogecoin Attracts Attention with Promising Surge Signs

Dogecoin Forms Rare Diamond Bottom Pattern Hinting at Major Price Surge

COINTURK NEWS 22 December, 2023 - 9:47 pm 22 December, 2023 - 9:47 pm
Share This Article
Facebook Twitter
Share
Previous Article Understanding Bitcoin’s Four-Year Cycle: Strategic Analysis and Predictions
Next Article Analysts Reveal the Expected End Date of Bitcoin’s Bull Run
Leave a comment

Leave a Reply Cancel reply

Your email address will not be published. Required fields are marked *

This site uses Akismet to reduce spam. Learn how your comment data is processed.

Stay Connected

8.1k Like
21.1k Follow
1.1k Follow

Latest News

VanEck Challenges SEC’s Delays on Bitcoin ETF Decisions
Cryptocurrency Law
Tesla Holds $1.25 Billion in Bitcoin: Inside Their Bold Crypto Strategy
Bitcoin News Cryptocurrency News
The Future of Cryptocurrencies Takes a New Turn
Altcoin News
Cryptocurrency Market Surge Projections Fire Up Enthusiasts
Technical Analysis
//

COINTURK was launched in March 2014 by a group of technology enthusiasts who believe that Bitcoin will be as important as the internet in the world of the future thanks to the amazing technology underlying it.

CRYPTOCURRENCY LIVE PRICES

  • Bitcoin (BTC) Live Price
  • Ethereum (ETH) Live Price
  • Ripple (XRP) Live Price
  • Solana (SOL) Live Price
  • Dogecoin (DOGE) Live Price
  • Cardano (ADA) Live Price
  • Chainlink (LINK) Live Price

OUR PARTNERS

  • COINMARKETCAP
  • COINGECKO
  • BITCOINHABER
  • BH NEWS
  • 21MILYON
  • NEWSLINKER

OUR COMPANY

  • About Us
  • Cookie Policy
  • Advertising
  • Contact
COINTURK NEWSCOINTURK NEWS
Follow US
© 2025 BLOCKCHAIN Information Technologies. >> COINTURK NEWS
Powered by LK SOFTWARE
Welcome Back!

Sign in to your account

Lost your password?