While the optimistic process regarding spot Bitcoin ETF applications continues in the cryptocurrency market, Bitcoin price has been experiencing selling pressure in recent days. During this period, investors continue to turn to projects that lag behind the market. The recent surge in momentum on the Polygon front is a good example of this. So, what is expected for MATIC in the coming period? Let’s examine together.
MATIC Four-Hour Analysis
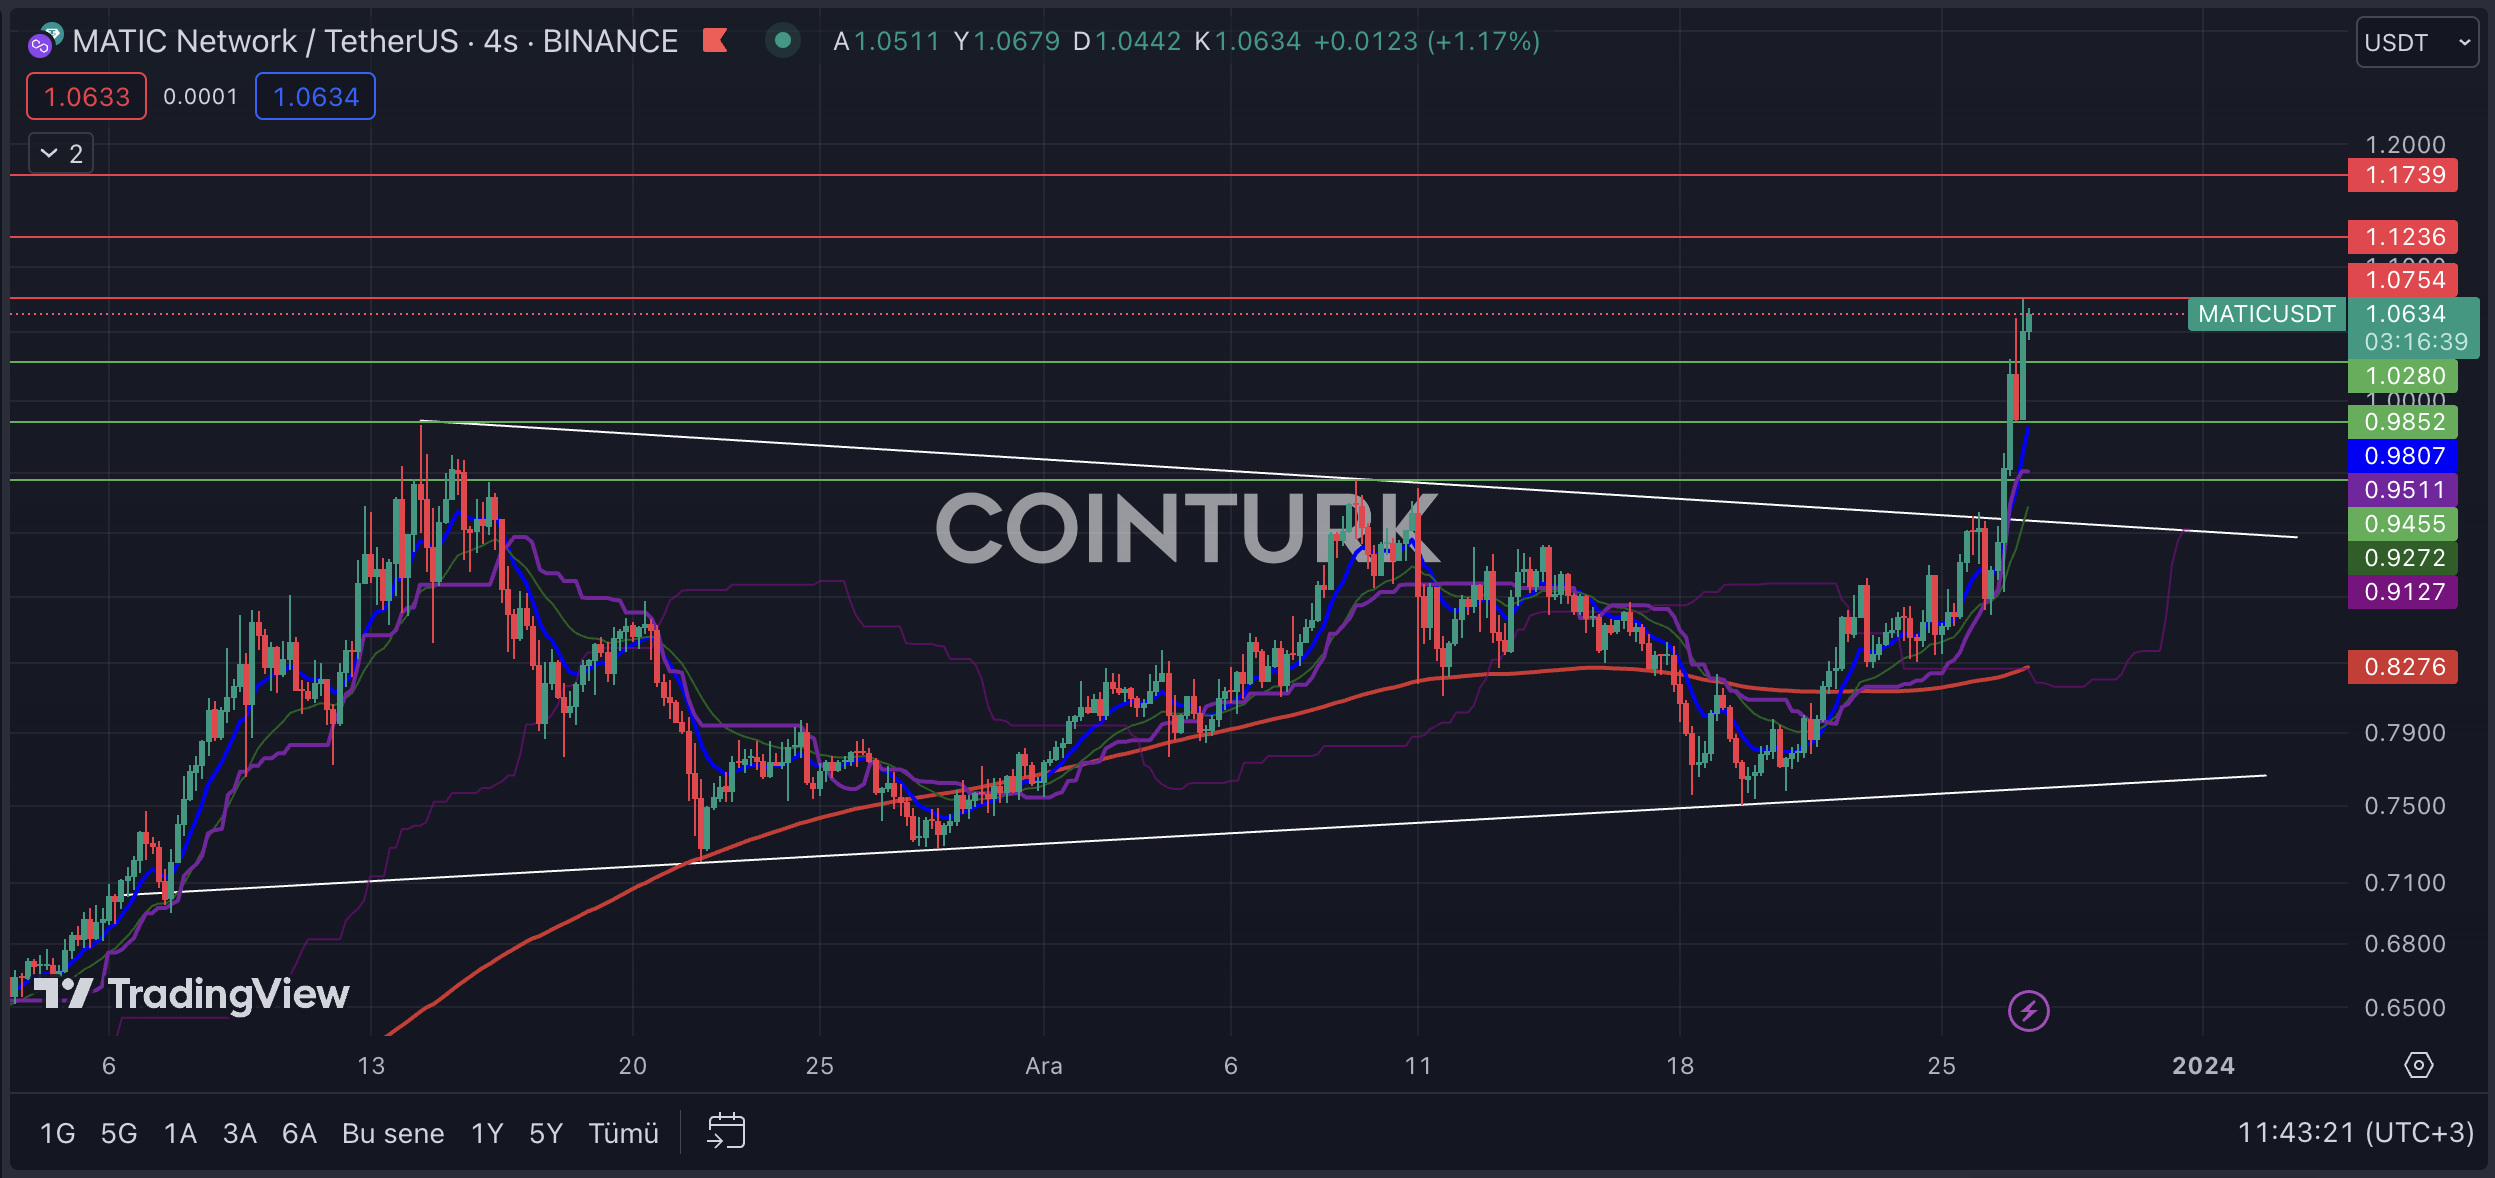
The first notable formation in the four-hour MATIC chart is a contracting wedge pattern. The fact that this formation did not break any support or resistance until December 26 provided an important clue, especially for futures market investors. The breakout on December 26 helped MATIC’s price gain momentum.
The most important support levels to follow on the MATIC chart are respectively; $1.02, $0.98, and $0.94. Especially, a four-hour bar close below the $0.98 level, which served as a significant support during the last selling pressure, will lead to an increase in selling pressure on the MATIC front.
The most important resistance levels to watch on the four-hour MATIC chart are respectively; $1.07, $1.12, and $1.17. Particularly, a four-hour bar close above the $1.07 level, which acted as a significant resistance during the recent upward movement, will help MATIC’s price gain momentum and reach the highest levels of recent months.

MATIC/ETH Chart Analysis
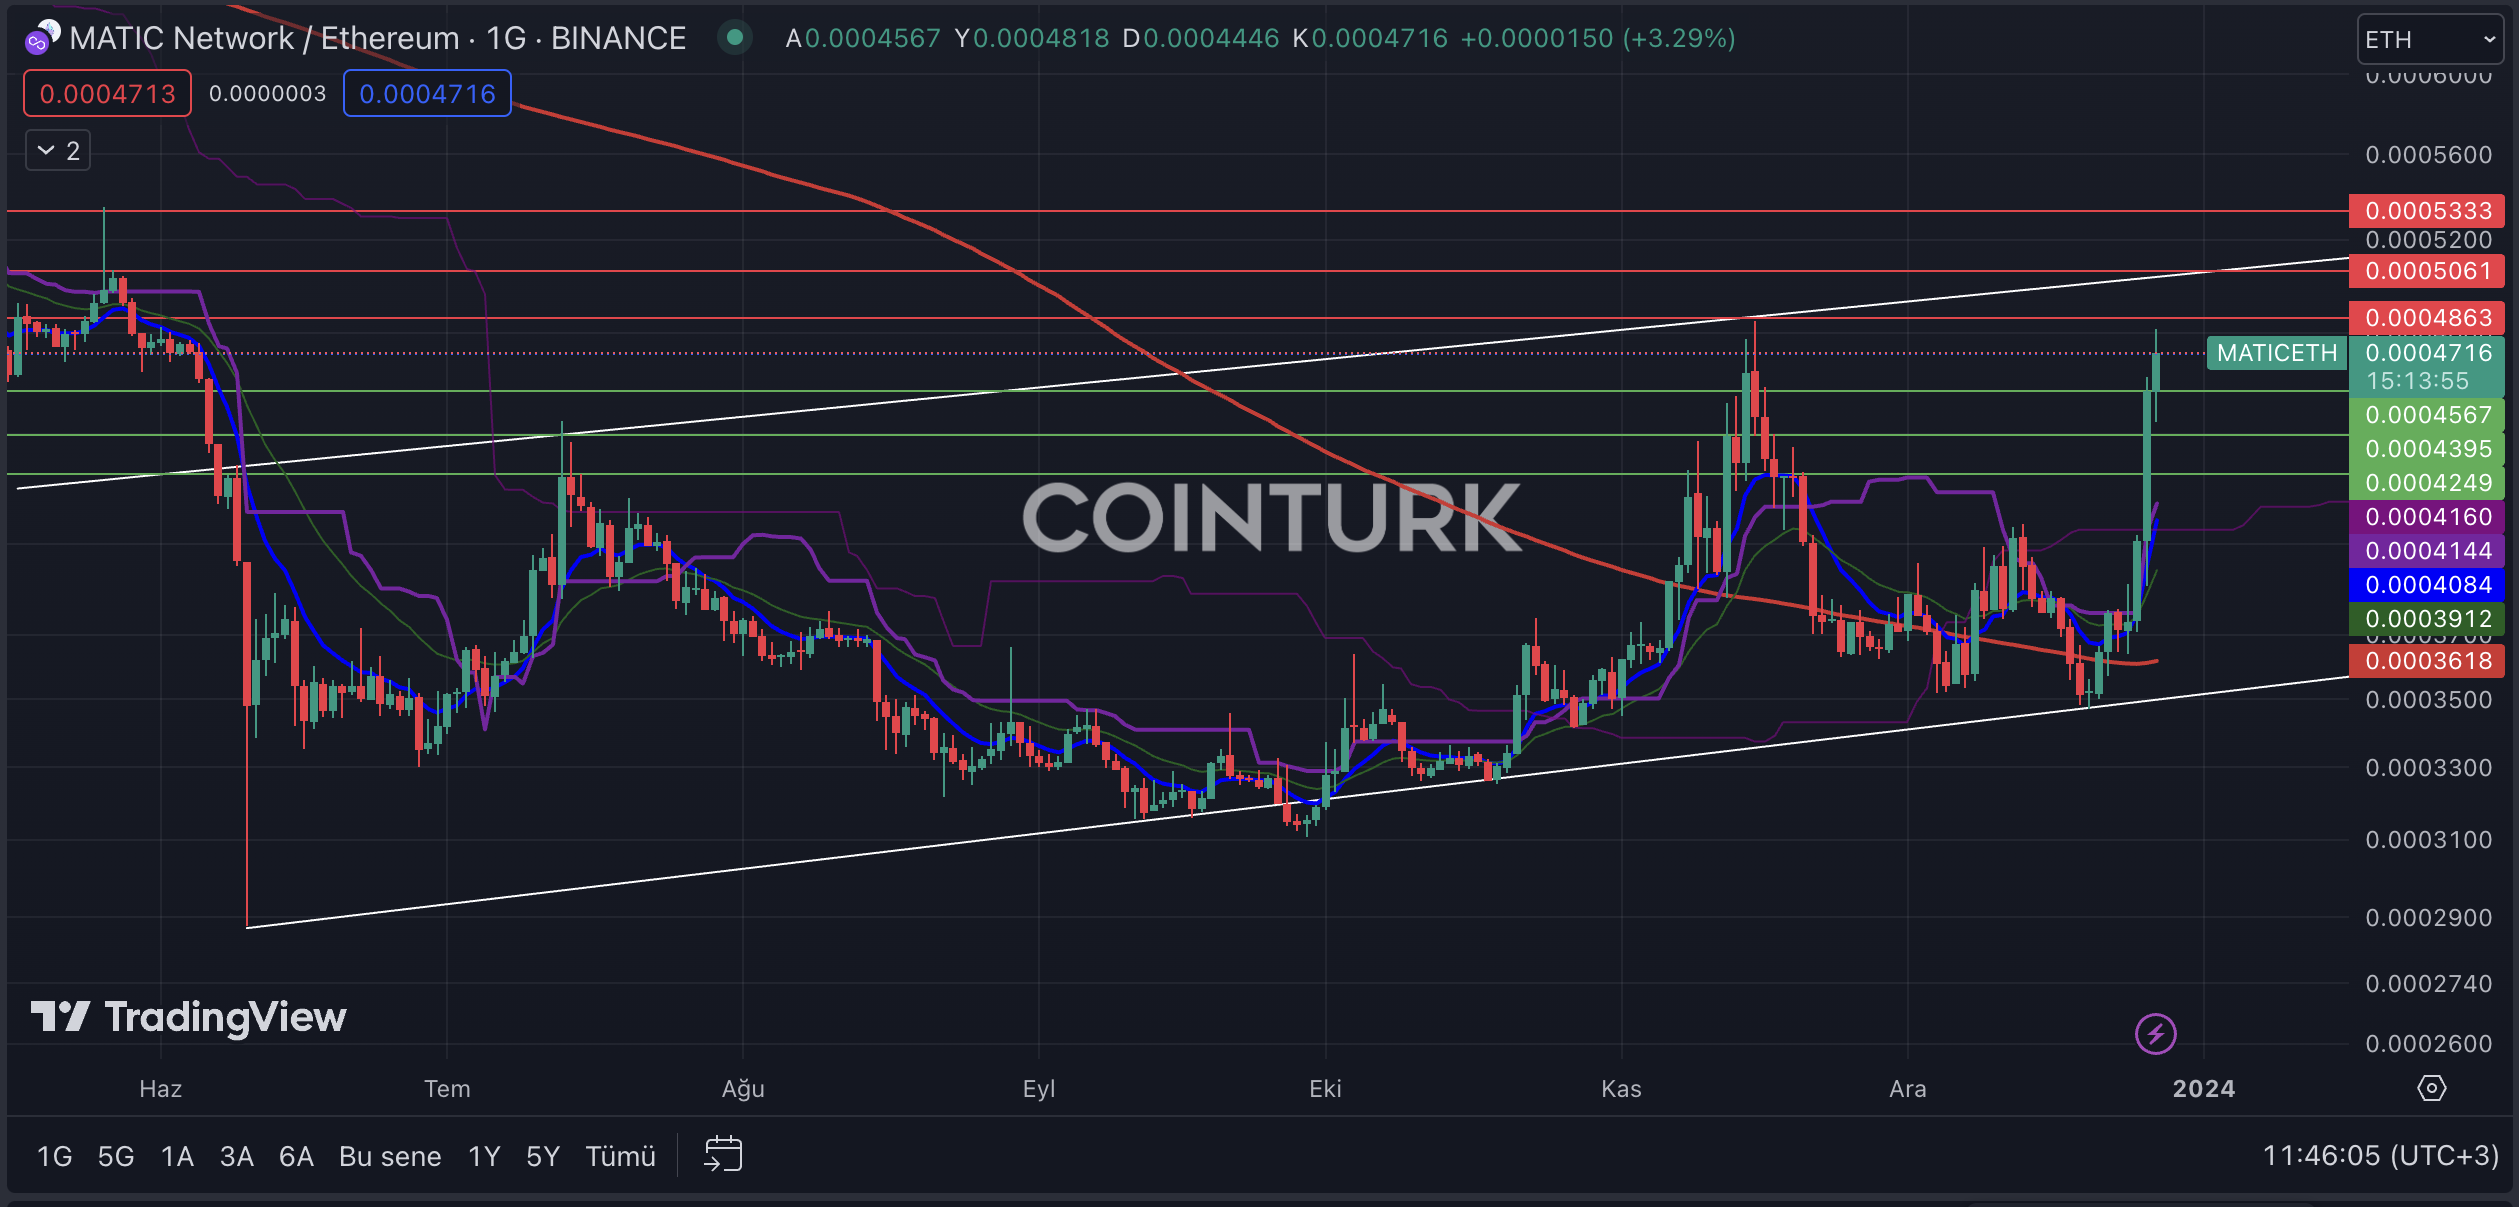
The first noticeable formation structure in the daily MATIC/ETH chart is an ascending channel formation. The fact that there has only been one support break since June has provided significant data for investors. The recent surge in momentum and crossing the EMA 200 (red line) level helped ignite the rally in the pair.
The most important support levels to follow on the MATIC/ETH chart are respectively; 0.00004567, 0.00004395, and 0.00004249. Especially, a daily bar close below the 0.00004395 level, which faced selling pressure in the recent upward bars, will cause the MATIC/ETH pair to lose value.
The most important resistance levels to watch on the MATIC/ETH chart are respectively; 0.00004863, 0.00005061, and 0.00005333. Particularly, a daily bar close above the 0.00005061 level, which intersects with the formation resistance line, will enable MATIC to gain value against Ethereum.


