With the developments in the crypto market, a competition that has caught the attention of crypto communities over the past week has started to emerge: Solana and Ethereum. Especially in the ongoing competition in the blockchain field, the recent decrease in Solana’s price while Ethereum’s price increases could lead to a growing interest in Ethereum. So, what do the charts indicate? Let’s examine together.
Ethereum Chart Analysis
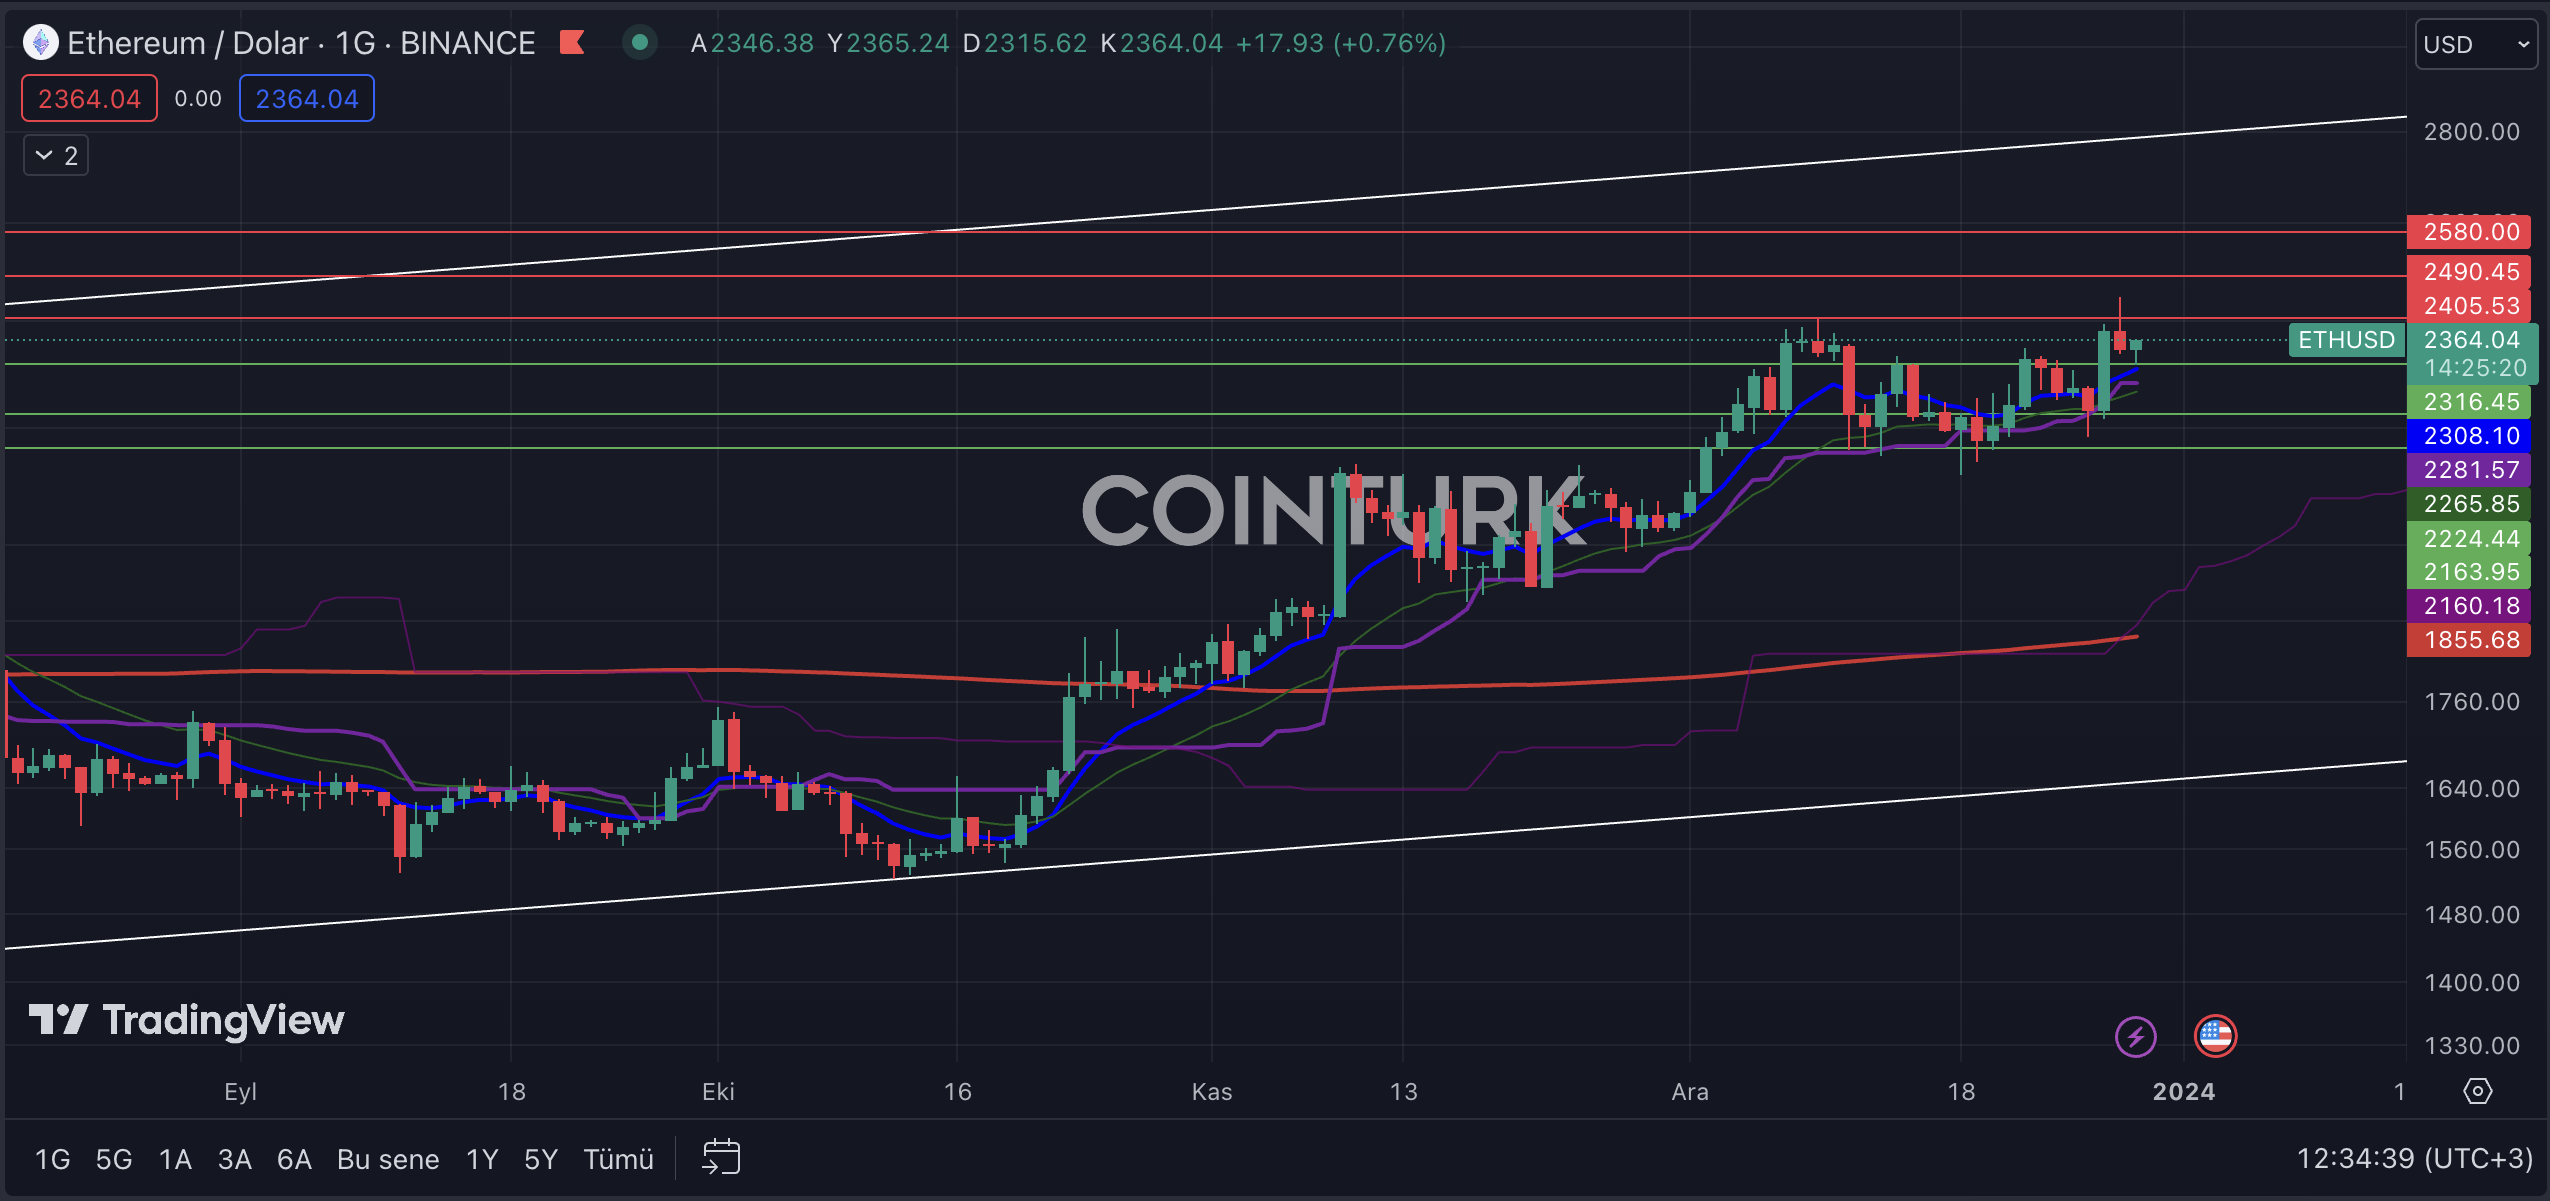
The daily Ethereum chart continues to draw attention with its rising channel formation. Ethereum, which touched the support line in the second week of October, gained significant momentum after this movement, making its investors happy. The latest bar formation finding support at the EMA 21 (blue line) level could lead to a positive scenario for Ethereum’s price.
The most important support levels to monitor on the daily Ethereum chart are, respectively; 2316 / 224 and 2163 dollars. In particular, a daily bar closing below the $2163 level, where the Ethereum price is squeezed in a narrow range, could lead to Ethereum facing selling pressure.
The most important resistance levels to watch on the Ethereum chart are, respectively; 2405 / 2490 and 2580 dollars. A daily bar closing above the $2405 level, which has been a major obstacle in recent upward movements, will allow us to see the highest level in recent times and will help Ethereum gain momentum.

ETH/BTC Chart Analysis
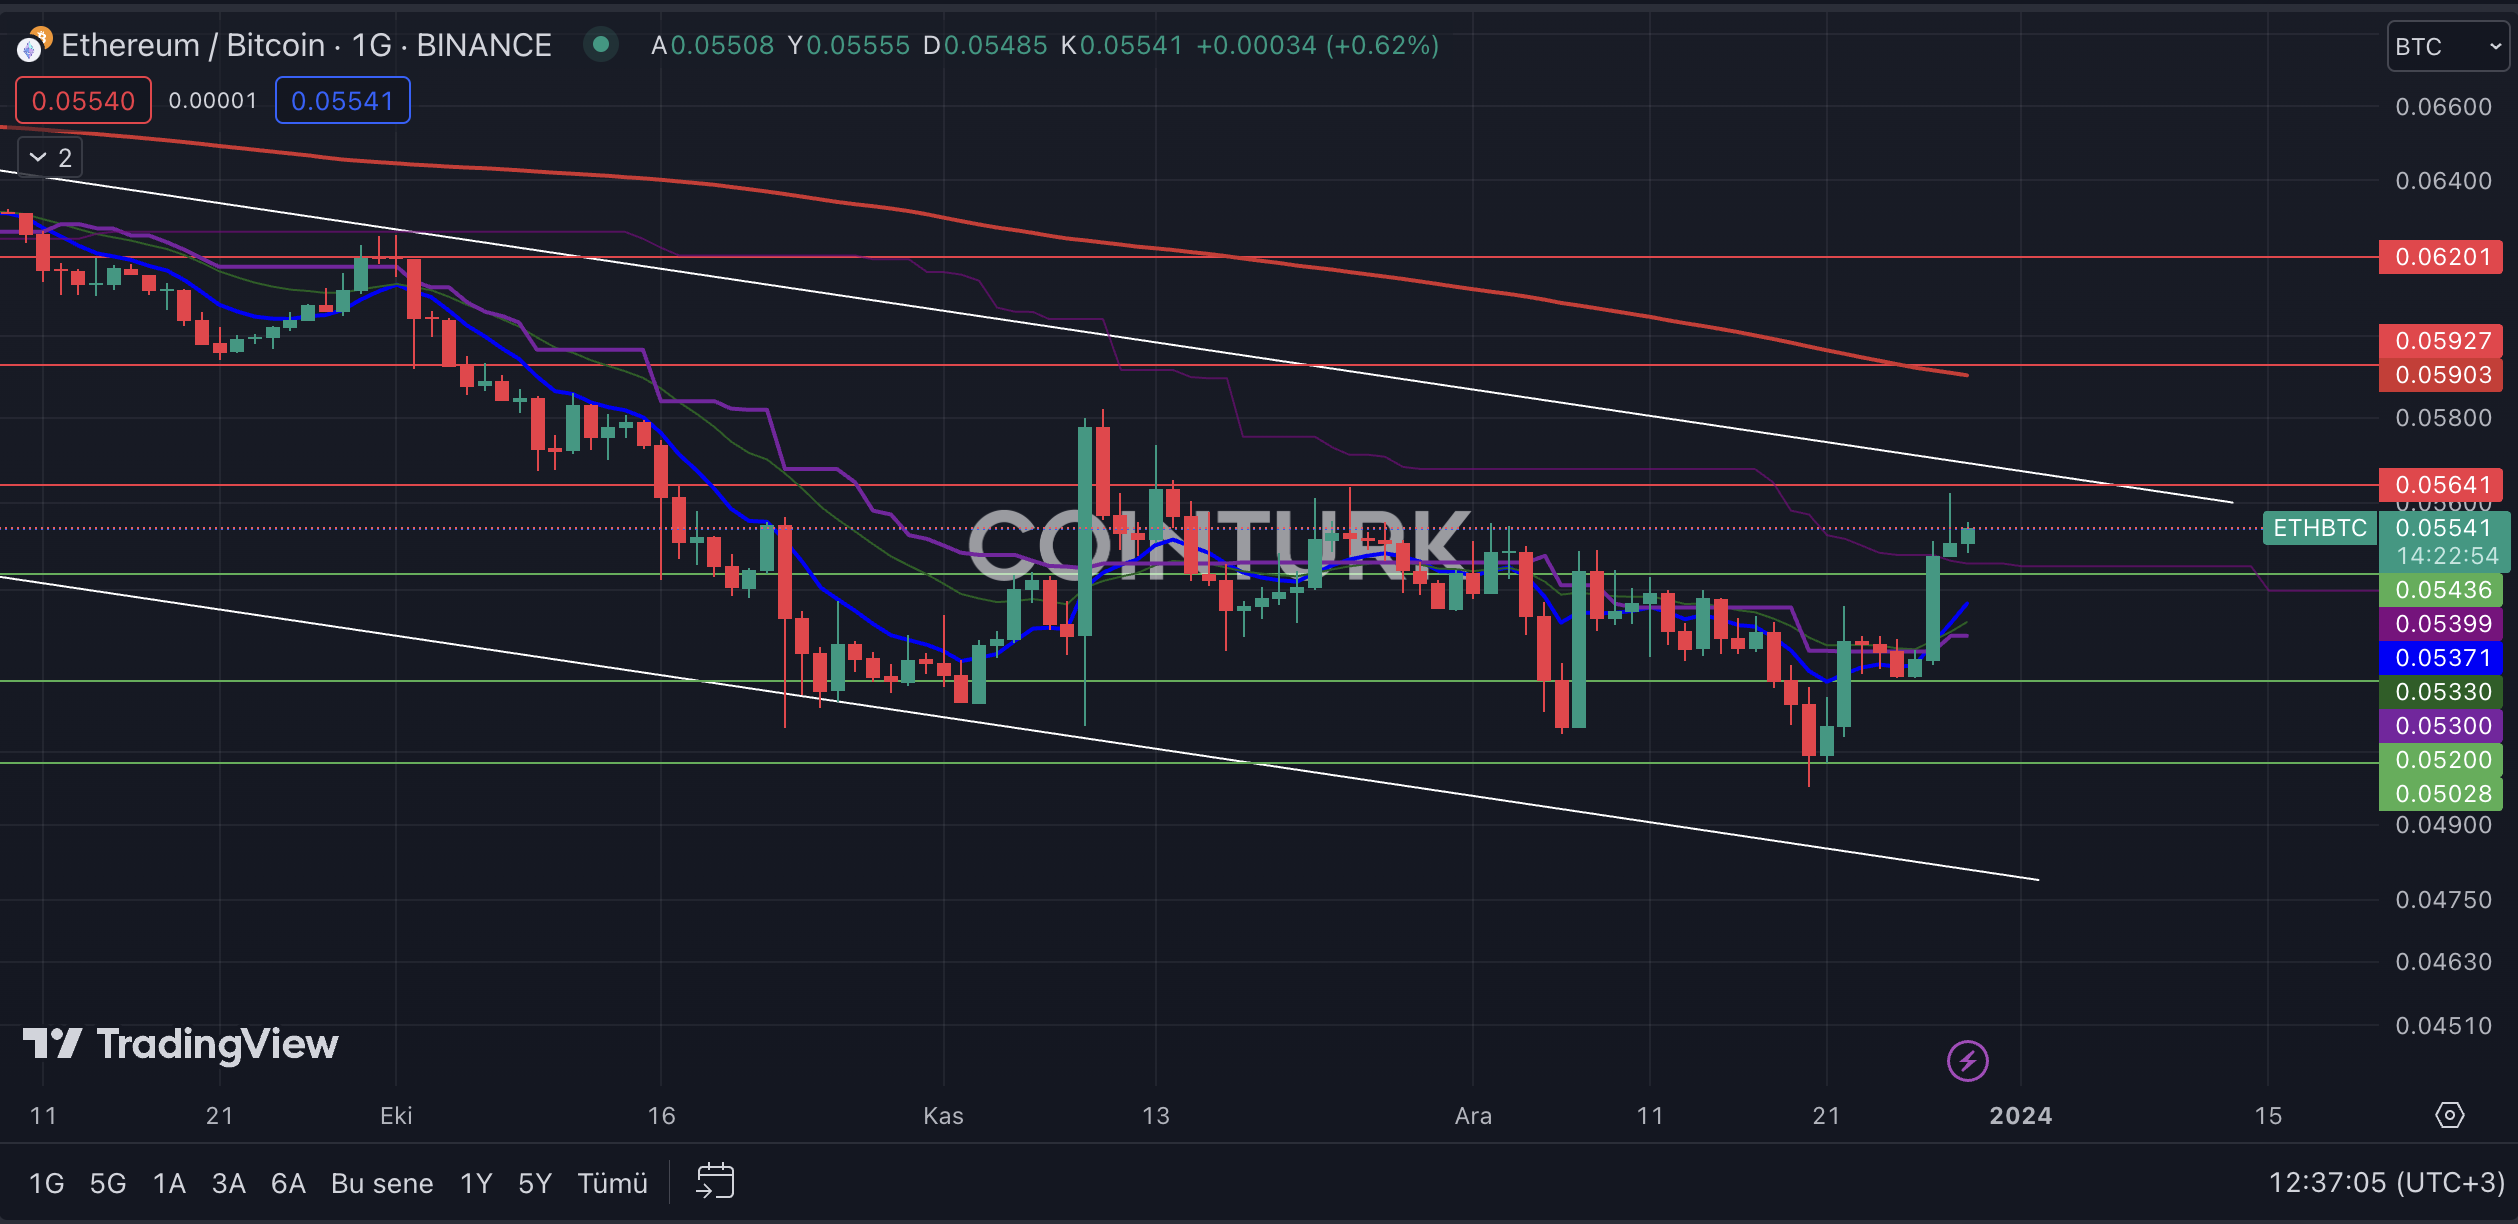
The first notable formation in the ETH/BTC pair is a falling channel formation. In this formation structure, if the pair breaks the resistance level, Ethereum could continue to gain value against Bitcoin.
The most important support levels to follow in the ETH/BTC pair are, respectively; 0.05436 / 0.05200 and 0.05028. Especially, a daily bar closing below the 0.05436 level, which recently acted as resistance and was broken, could lead to Ethereum losing value against Bitcoin.
The most important resistance levels to consider in the ETH/BTC pair are, respectively; 0.05641 / 0.05927 and 0.06201. Particularly, a daily bar closing above the 0.05927 level, which intersects with the EMA 200 (red line), would enable Ethereum to gain significant momentum against Bitcoin.


 Türkçe
 Español


