While the crypto market eagerly awaits, the altcoin market continues to lose value during this period. As Bitcoin‘s dominance in the crypto market continues to grow, investors have been shifting from altcoin projects to Bitcoin. So, what do the charts indicate for the popular Layer-2 projects Arbitrum and Optimism in recent days? Let’s examine together.
Arbitrum Chart Analysis
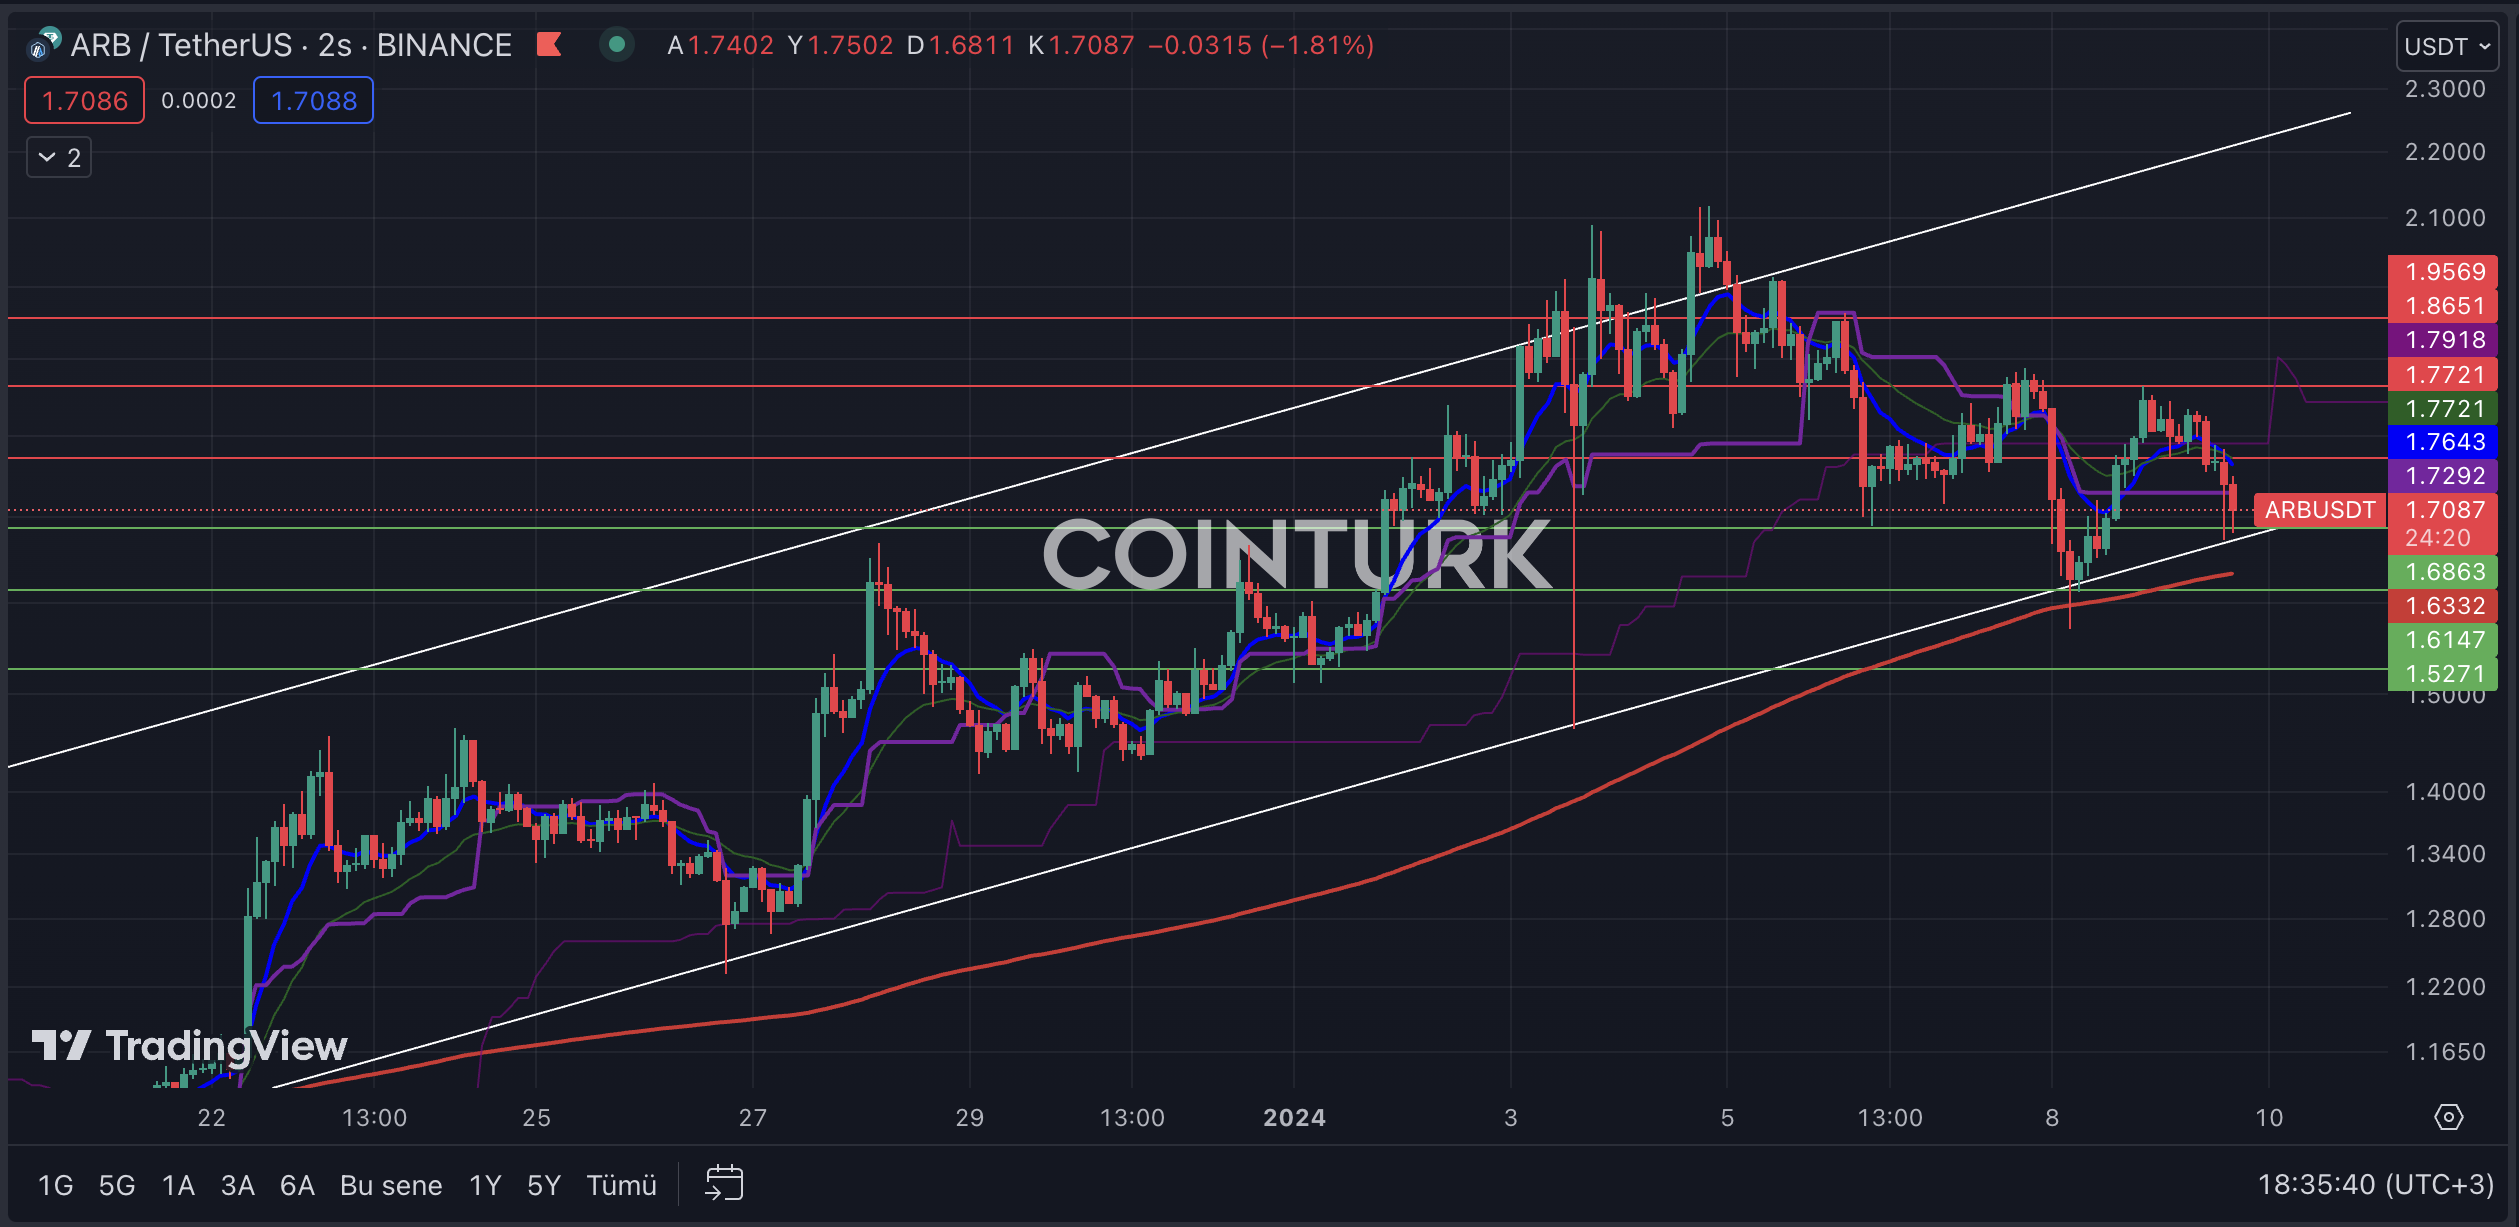
Arbitrum has been giving investors clues to watch out for in its two-hour chart with a rising channel formation. After a long period, ARB gained momentum but failed to break the formation resistance and fell back to the support level. On January 8th, ARB, which found support at the EMA 200 (red line) level, is now seeing a positive scenario emerge.
The most important support levels to watch on the two-hour Arbitrum chart are, respectively; $1.6863, $1.6147, and $1.5271. A two-hour bar closing below the $1.6863 level, especially where it intersects with the formation support line, will disrupt the formation structure and lead to selling pressure on ARB.
The most important resistance levels to follow on the Arbitrum chart are, respectively; $1.7721, $1.8651, and $1.9569. A two-hour bar closing above the $1.7721 level, which has been a significant barrier in recent closings, will help ARB gain momentum.

Optimism Chart Analysis
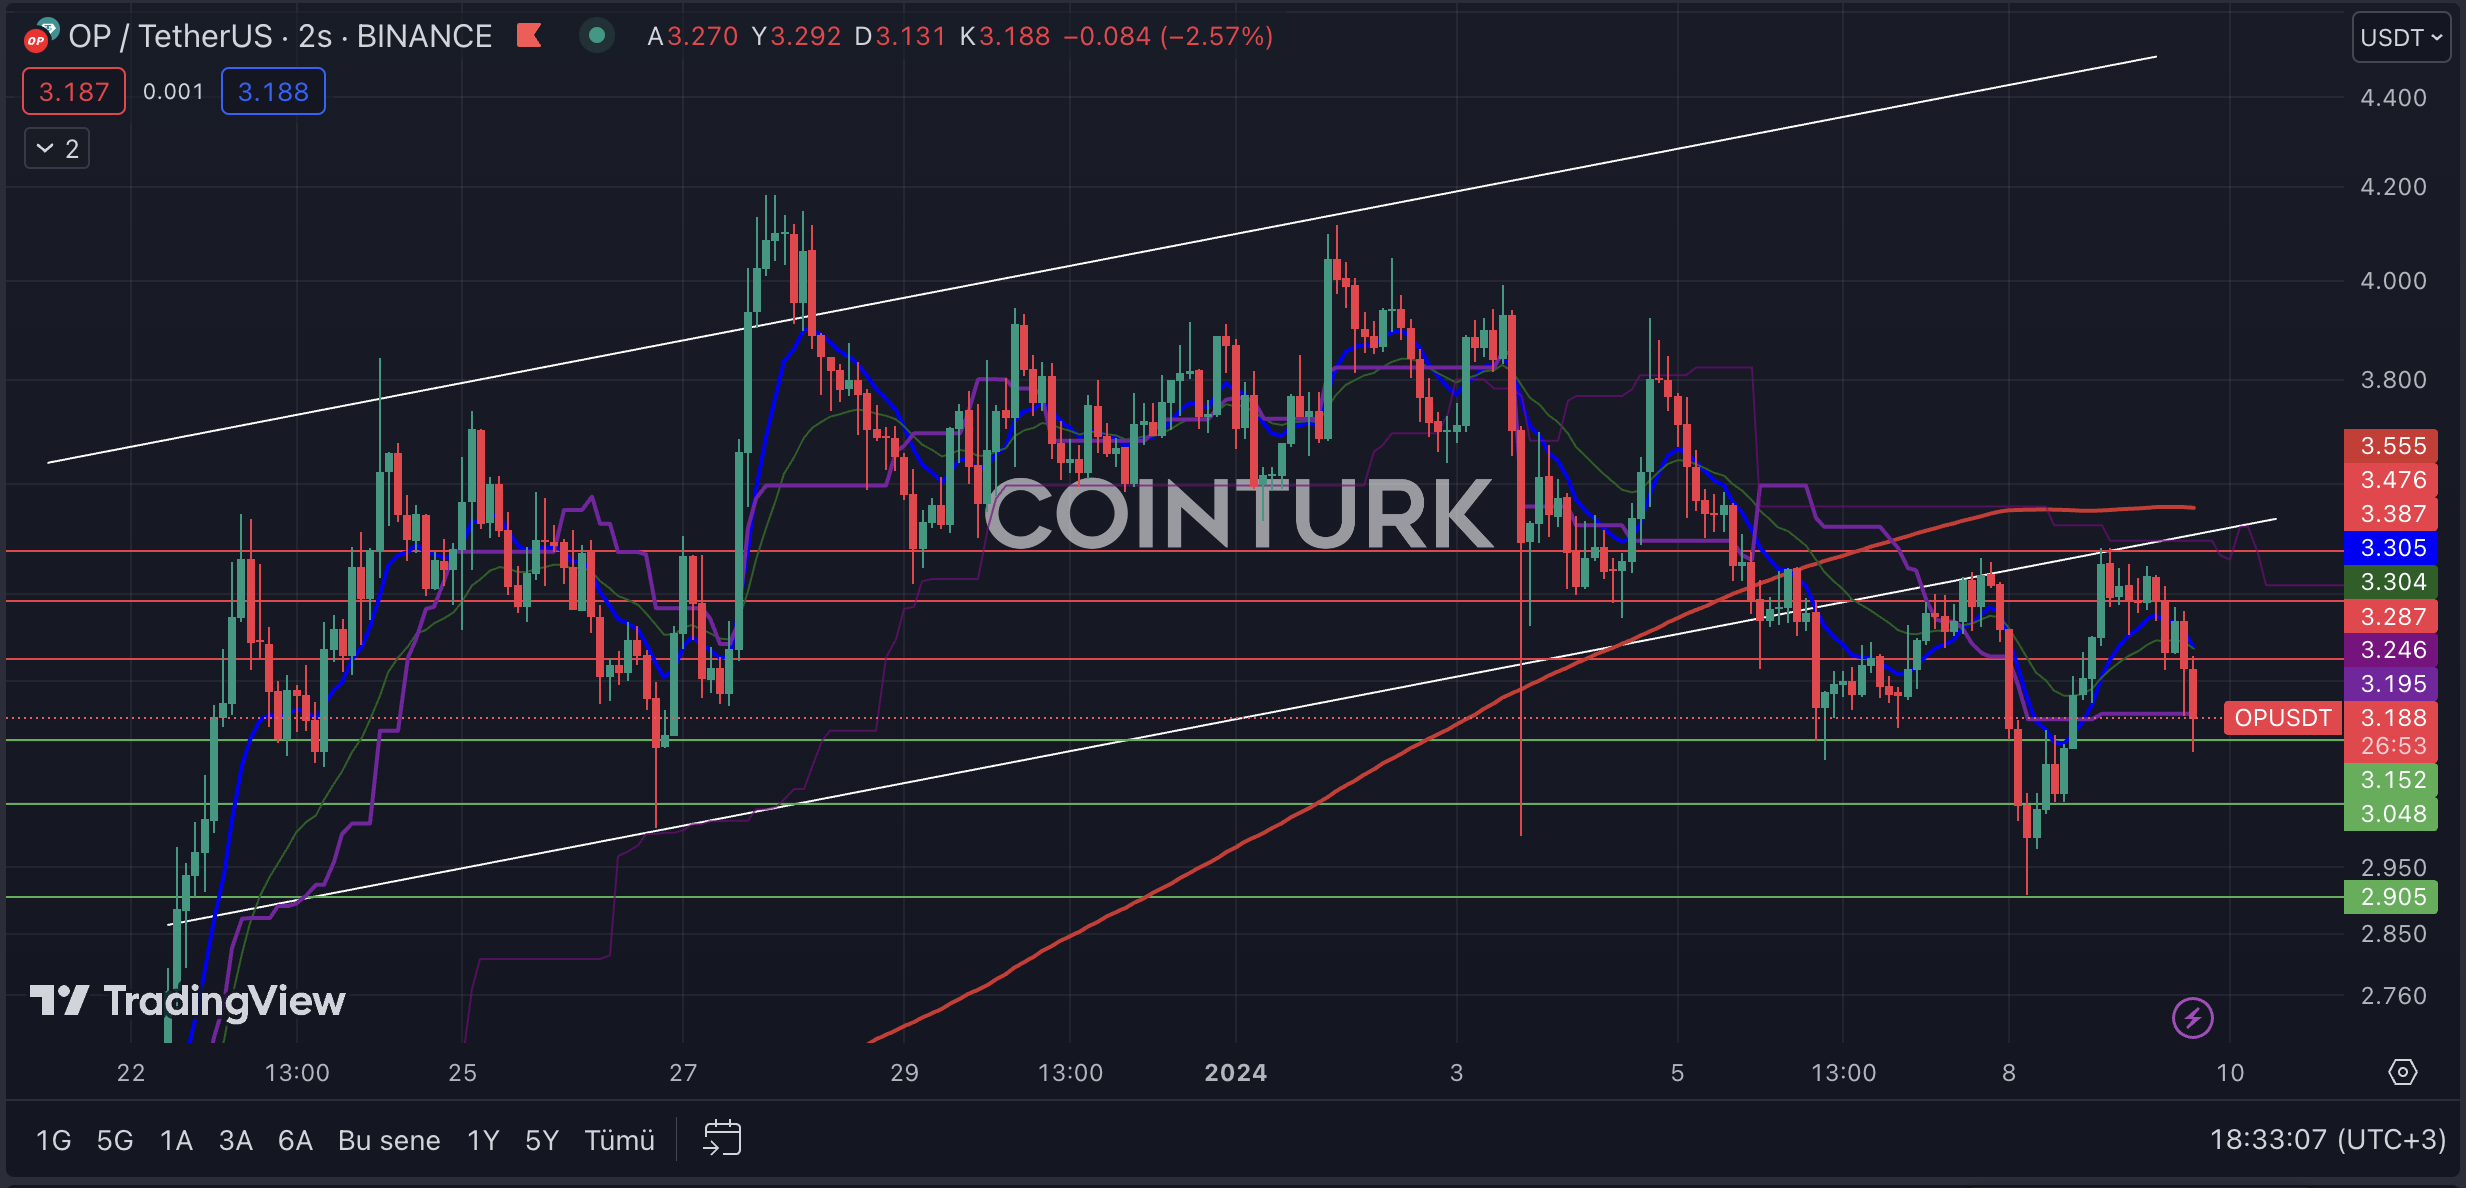
The two-hour Optimism chart with a rising channel formation provided significant clues to investors until the drop on January 5th. The structure that broke resistance on December 28th acted as a bull trap and managed to deceive investors. However, the recent drop turned the support line into resistance, which could lead to a loss of momentum for the OP price soon.
The most important support levels to monitor on the two-hour Optimism chart are, respectively; $3.152, $3.048, and $2.905. A two-hour bar closing below the $3.152 level, which has been notable in recent formations, will result in selling pressure on OP.
The most important resistance levels to watch on the Optimism chart are, respectively; $3.287, $3.387, and $3.476. A two-hour bar closing above the $3.476 level, which intersects with the formation support line, will help OP gain momentum.


 Türkçe
 Español


