Chainlink (LINK), the 14th largest cryptocurrency by market value, is showing strength by significantly outperforming the general market sell-offs. While Bitcoin‘s (BTC) price has fallen below $41,000 and many major altcoins have pulled back sharply, LINK has sustained above $14.2. The primary reason for the altcoin’s strong performance is attributed to a bullish chart pattern known as the ‘inverse head and shoulders’ (TOBO), which could potentially lead to a rise up to $20.
LINK Indicates Uptrend Signal with Inverse Head and Shoulders Pattern
Following the launch of the Spot Bitcoin ETF, Bitcoin and other altcoins began showing a negative trend, while LINK’s price has been moving sideways for the last two months. The altcoin’s lack of significant price movement has fueled indecision among buyers and sellers.
Looking at the daily price chart, it is evident that the altcoin is moving between two trend lines, indicating a well-known chart formation called the ‘expanding channel’. This formation guides the price movement between the two trend lines before a definitive breakout during market uncertainty.
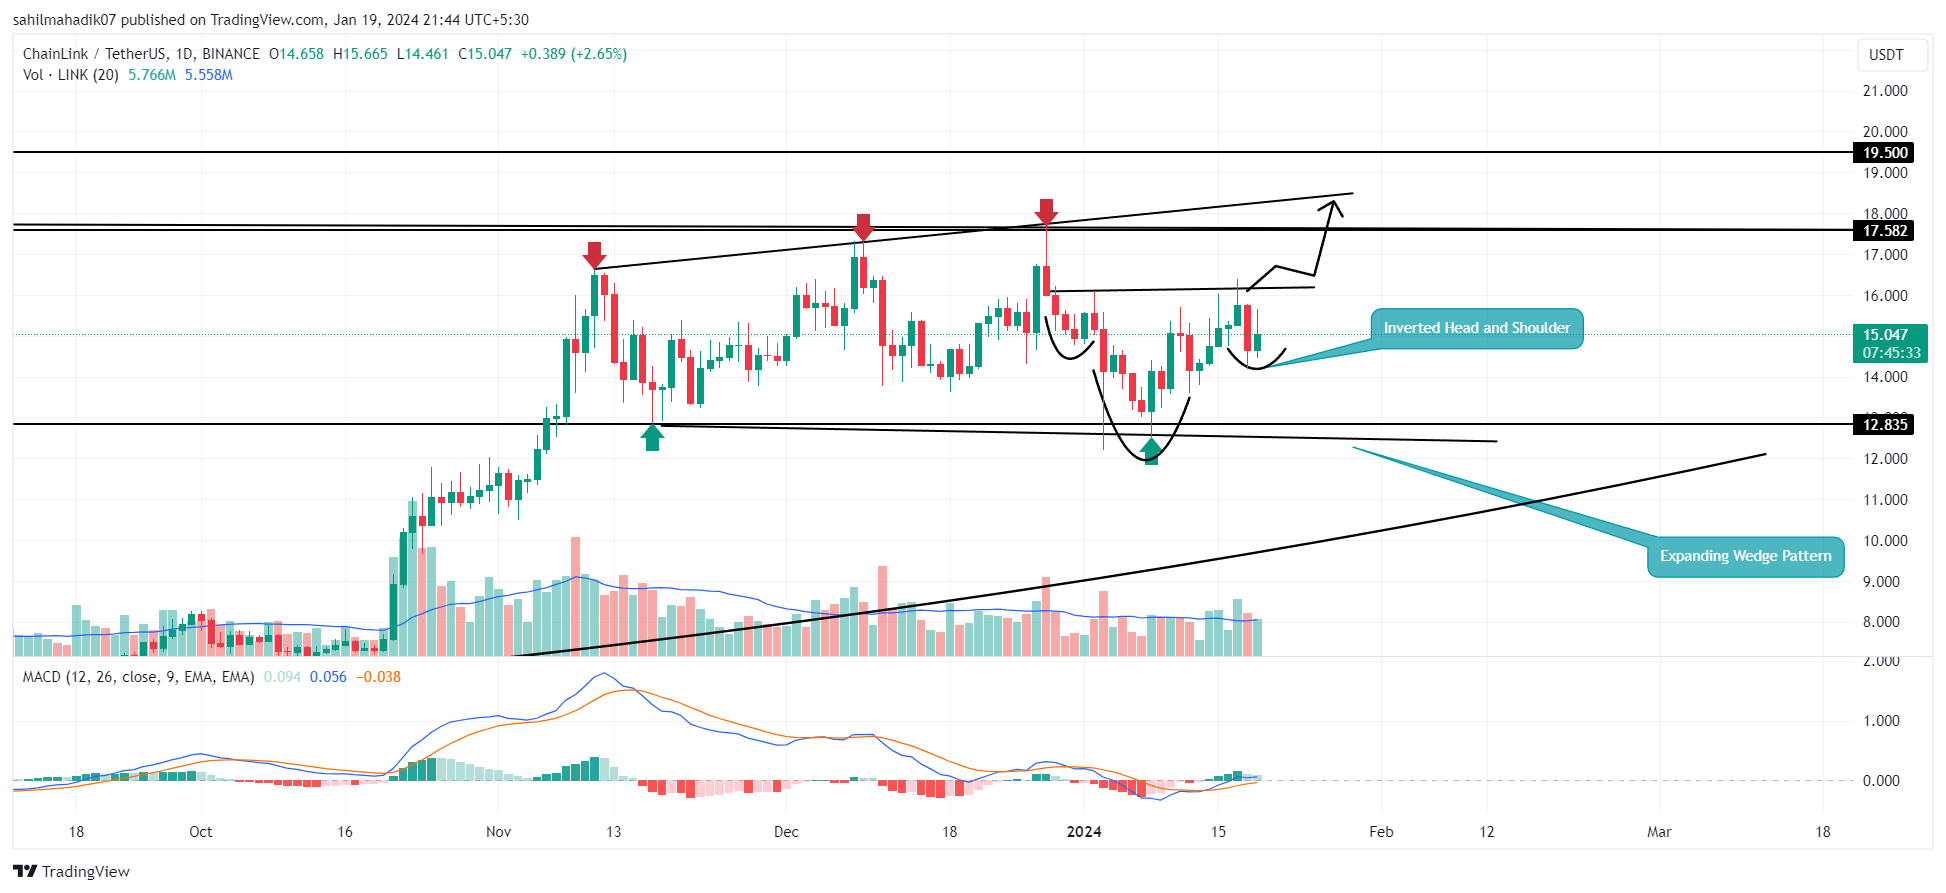
LINK last saw a 30% increase on January 8th, reaching up to $16.39, and then pulled back from the formation’s lower trend line. Amidst the current market sell-offs, LINK’s price is now successfully holding above the $14.2 level, demonstrating its strength.
On-chain data tracked by IntoTheBlock indicates a significant trend for LINK. Following a partial price drop, a whale-level investor saw this as an opportunity and made a purchase. The crypto whale bought 601,949 LINK at an average price of $14.81, amounting to $8.9 million. The distribution of LINKs to three new wallet addresses after this significant purchase is a sign of strong confidence in the altcoin.
Is Chainlink’s Price Ready for a Rise?
With renewed buying interest, LINK’s price is showing strength and facilitating the development of the TOBO formation. This bullish formation reflects a change in market dynamics and represents a significant recovery opportunity for buyers.
The altcoin, currently trading at $15.2, needs to break above the $16.2 neckline resistance. A potential breakout from here could support a long-term recovery of up to 15%, reaching the resistance of the parallel channel formation at $18.5. A sustained uptrend confirmation requires a breakout above this barrier, and a future breakout could lead to LINK rising to $20 and beyond.
Moreover, LINK’s price being above the 100-day EMA indicates that the prevailing trend is bullish. Additionally, the bullish crossover between the MACD (blue) and the signal (orange) lines reflects a returning sense of recovery in the market.


