The volatility in the cryptocurrency market, especially regarding the spot Bitcoin ETF process, has continued to decrease over the past four days. The price of Bitcoin, currently trading at $41,184, is exhibiting a notable formation pattern that may indicate a negative trend in the short term. Let’s take a closer look at what could happen in the upcoming period.
Bitcoin Chart Analysis
The first noticeable formation structure in the two-hour Bitcoin chart is the descending channel formation. The breakdowns at the support line have caused fear and concern among investors, but the closure of these bars within the formation has managed to prevent Bitcoin sales. Following the rise, Bitcoin is struggling at the EMA 21 (blue line) levels, with recent bar formations closing below this level.
The most important support levels to watch on the two-hour Bitcoin chart are, respectively; $41,032 / $40,687 and $40,295. Particularly, the closure of a two-hour bar below the crucial support level of $41,032 will lead to selling pressure on Bitcoin in the short term.
The most important resistance levels to watch for Bitcoin on the two-hour chart are, respectively; $41,236 / $41,544 and $41,989. Especially, a two-hour bar closing above the significant barrier of $41,989 in recent days will accelerate the momentum of the Bitcoin price.

Bitcoin Dominance Chart Analysis
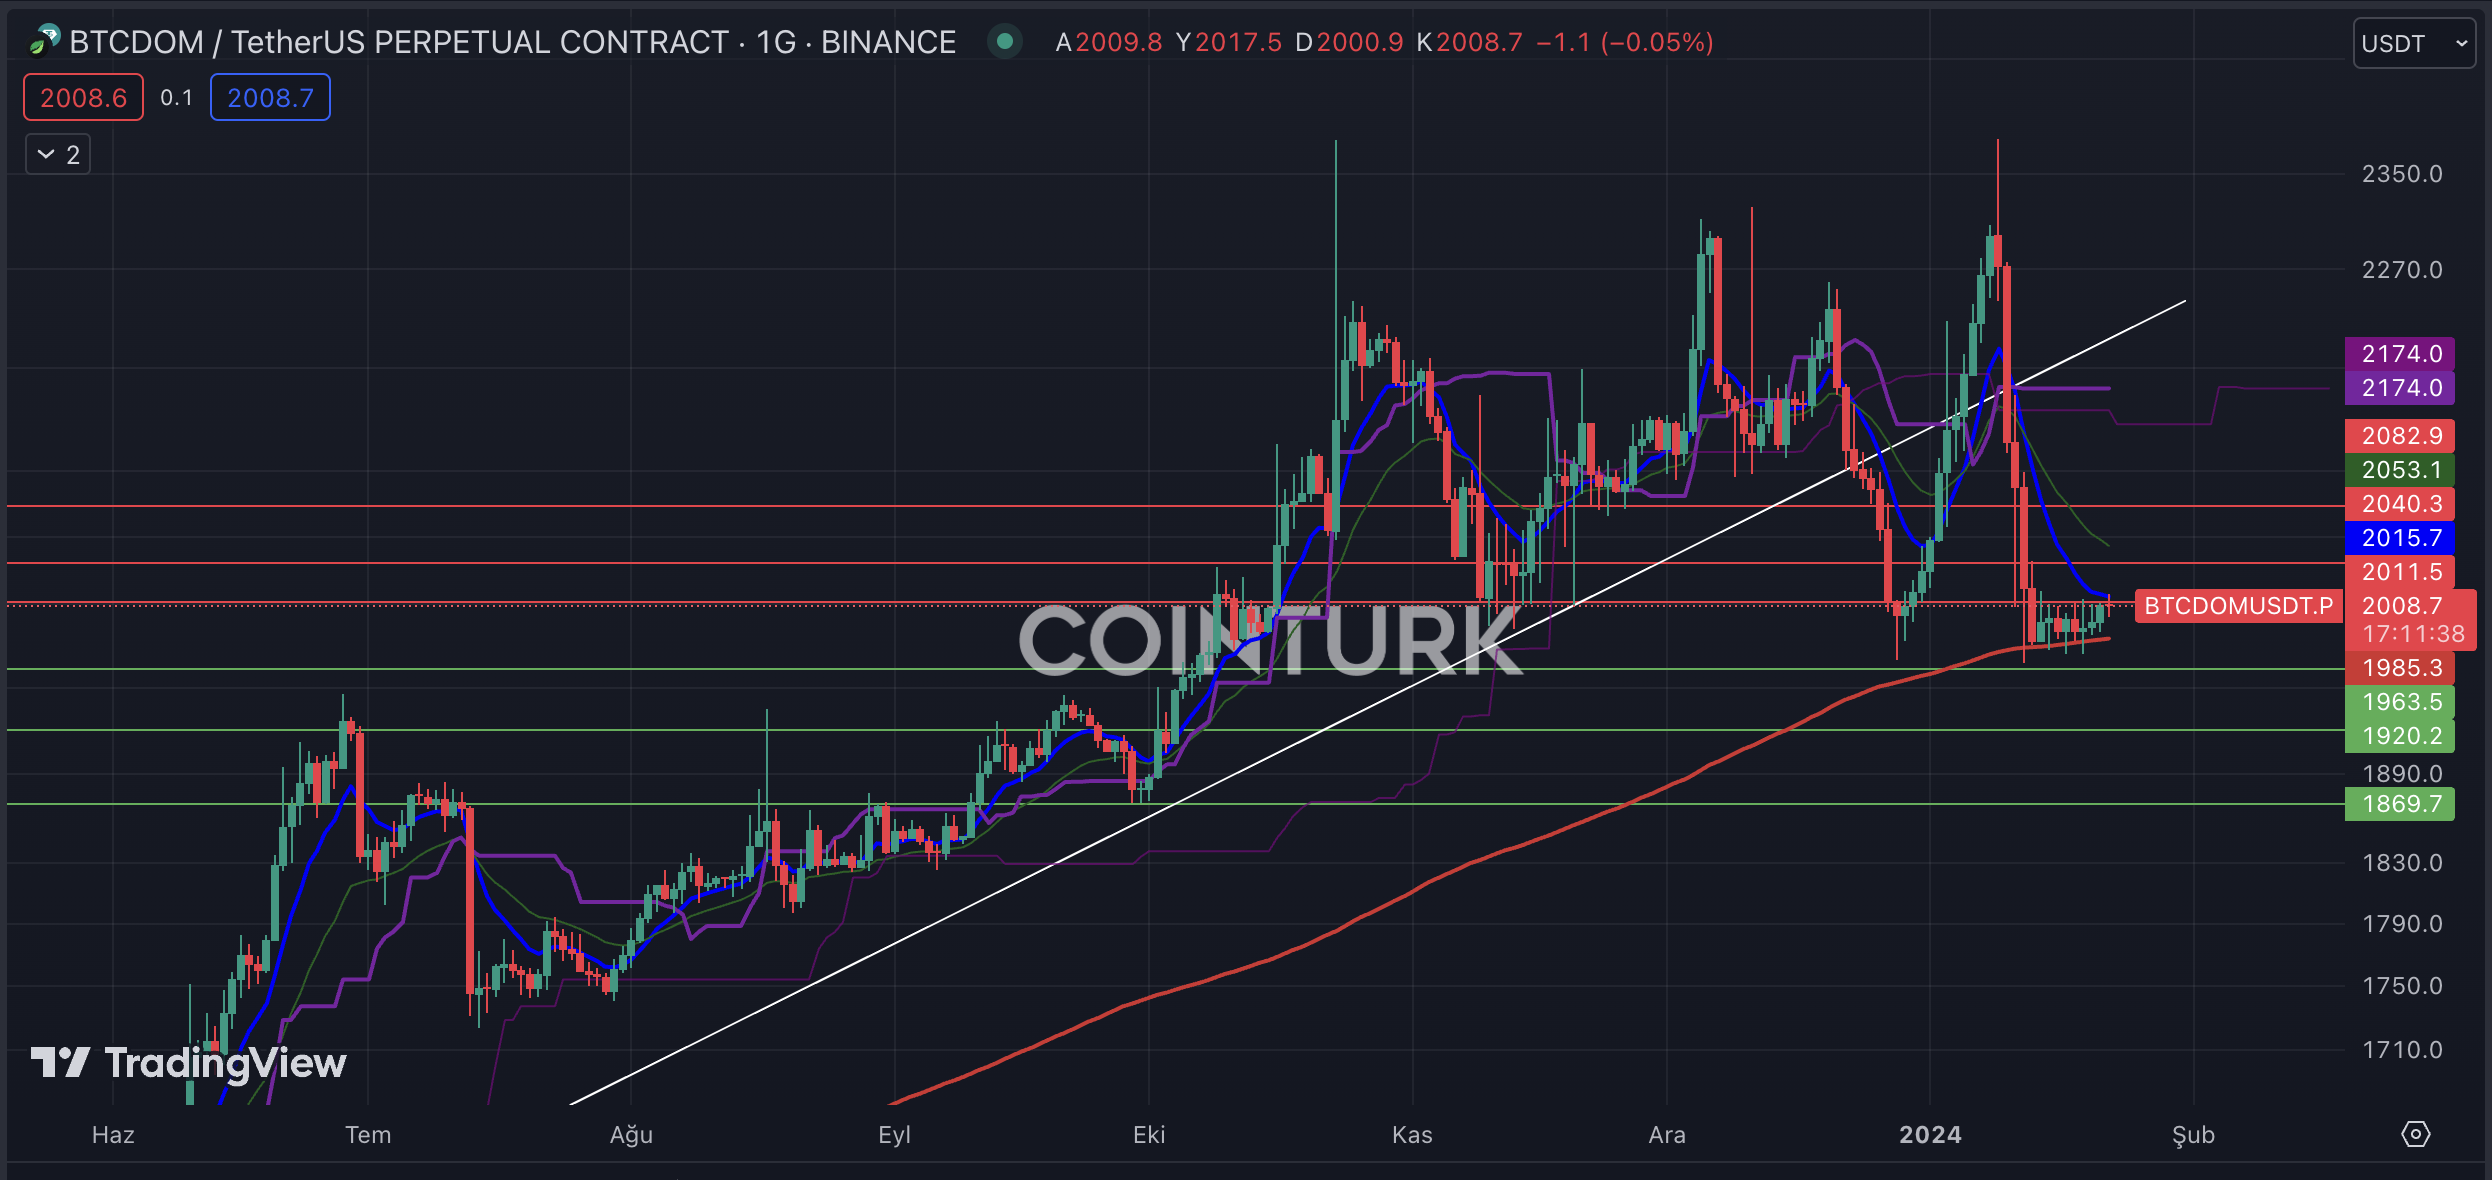
Following the approval of the spot Bitcoin ETF, BTCDOM gained significant momentum but experienced a serious decline after recent developments. The EMA 200 level acting as a support level has recently halted the decline. However, a breakout of support or resistance in the narrow range of BTCDOM will determine the direction of Bitcoin’s price.
The most important support levels to watch on the BTCDOM chart are, respectively; 1963 / 1920 and 1869. Particularly, a daily bar closing below the 1963 level will lead to a decrease in BTCDOM and while Bitcoin loses value, the altcoin market will gain value.
The most important resistance levels to watch on the BTCDOM chart are, respectively; 2011 / 2040 and 2082. Especially, a daily bar closing above the significant barrier of 2011 in recent days will help Bitcoin gain momentum relative to the altcoin market.


 Türkçe
 Español


