With developments in the cryptocurrency market, the price of Bitcoin has retreated to its lowest levels in recent times. The latest selling pressure has pushed Bitcoin below $39,000. During this period, especially the anticipated macroeconomic data from the US and the selling pressure from GBTC continue to weigh on Bitcoin. So, what’s next for Bitcoin? Let’s take a look.
Bitcoin Chart Analysis
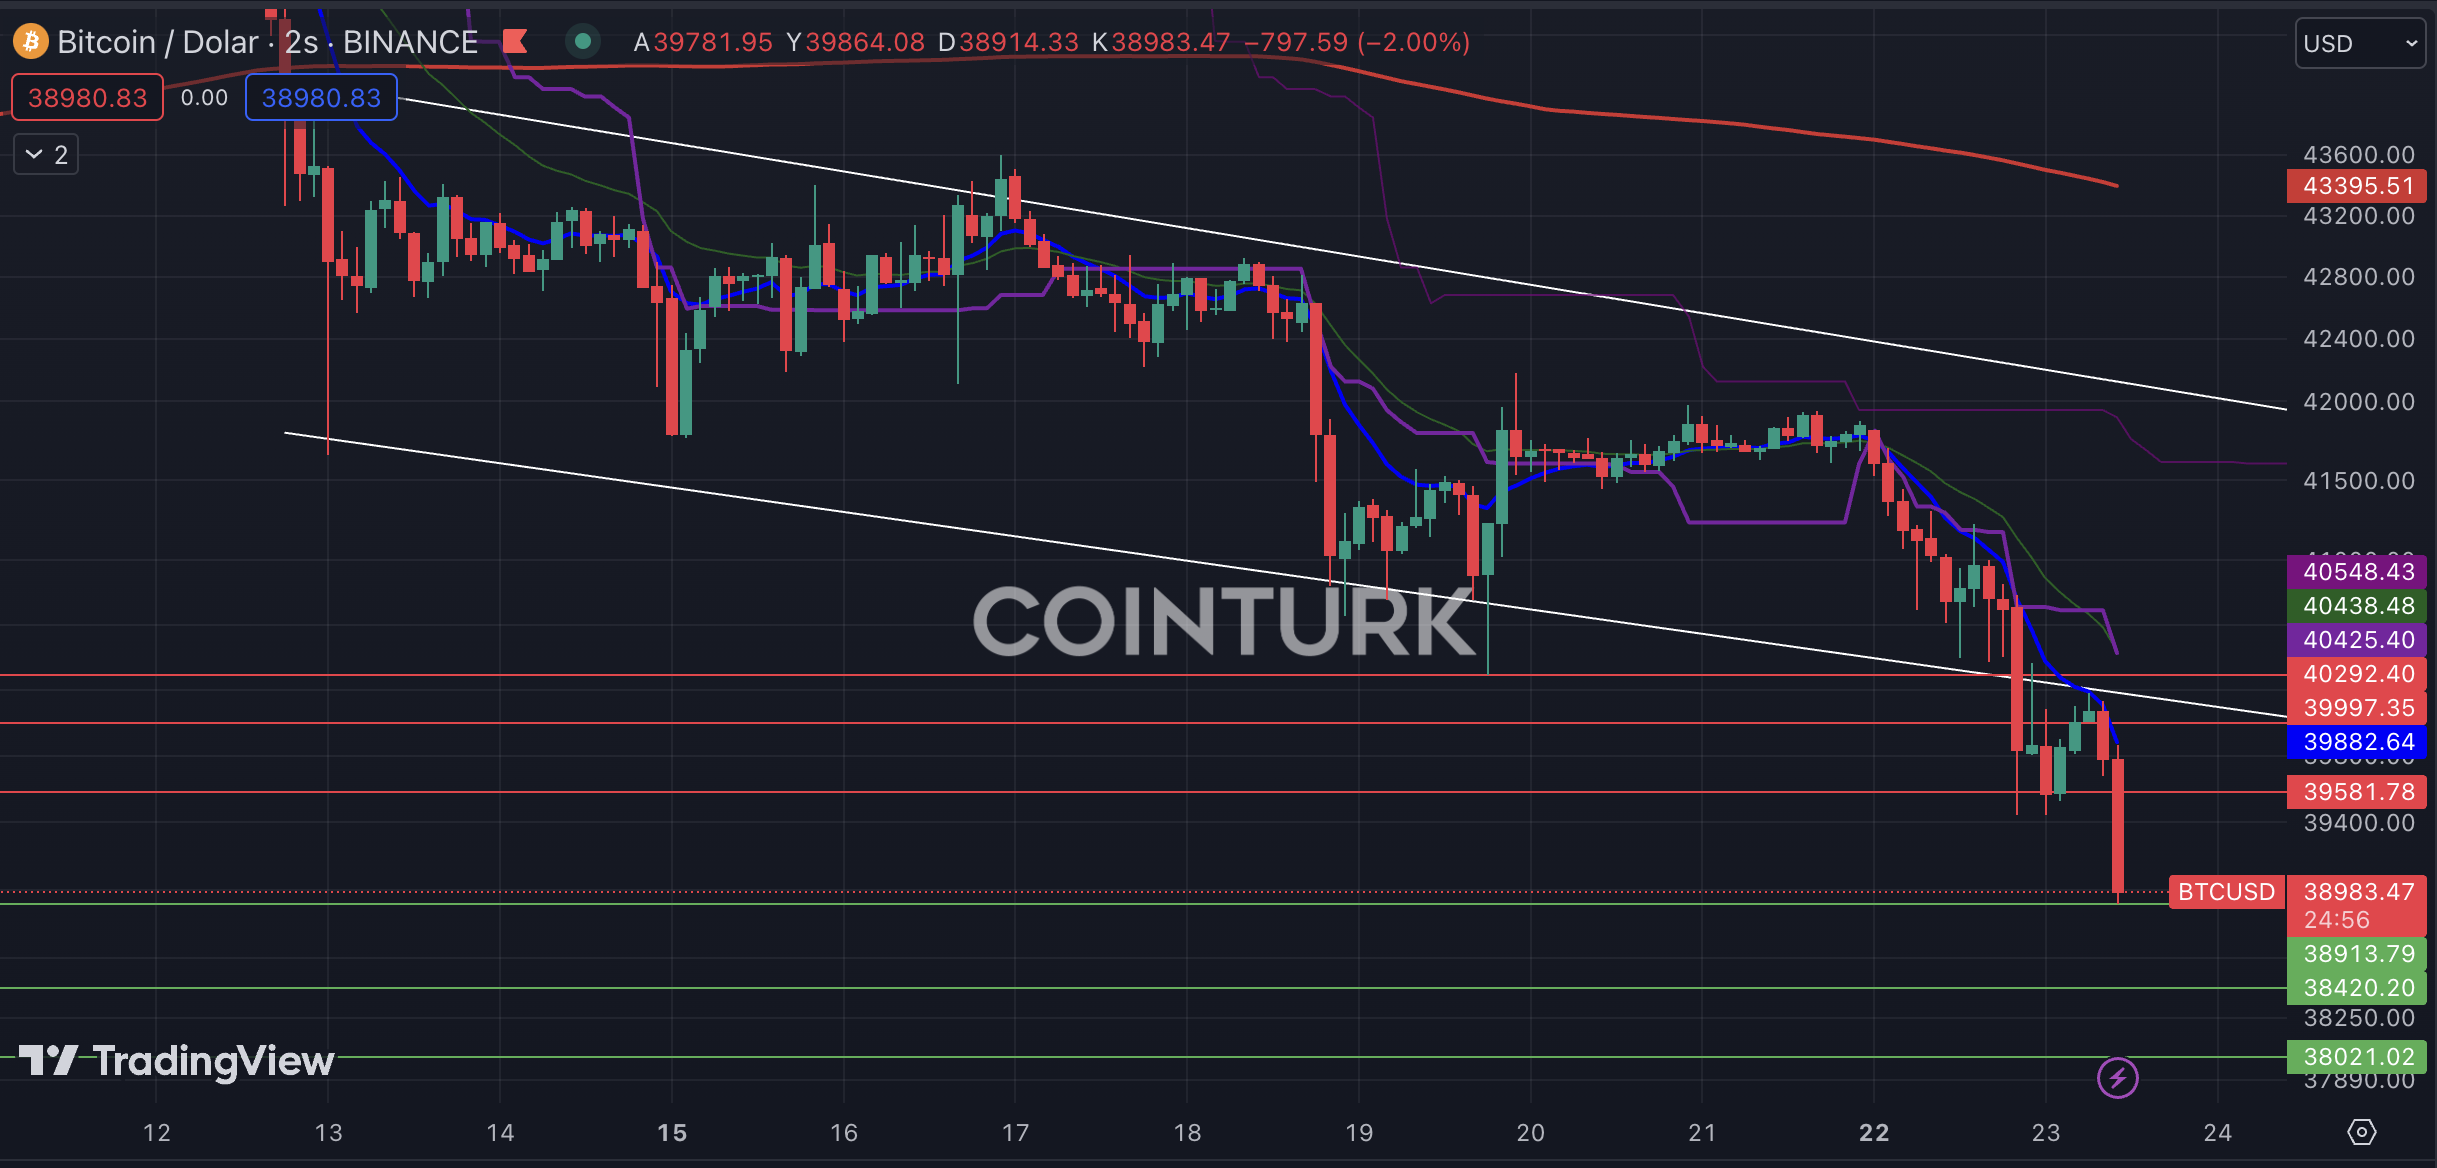
The first noticeable formation in the two-hour Bitcoin chart is the descending channel formation. Following the drop on the night of January 22, a support break occurred, which led to an increase in selling pressure on the Bitcoin front. Particularly, the resistance role of the EMA 21 (blue line) level in the latest bar formation could create short-term pressure on Bitcoin.
The most important support levels to watch for Bitcoin are, in order; $38,913 / $38,420 and $38,021. Especially, a two-hour bar close below the support level of $38,913 will lead to an increase in selling pressure on the Bitcoin front.
The most important resistance levels to watch for in the two-hour Bitcoin chart are, in order; $39,581 / $39,997 and $40,292. Particularly, a two-hour bar close above the $39,997 level will reduce the selling pressure on the Bitcoin front.