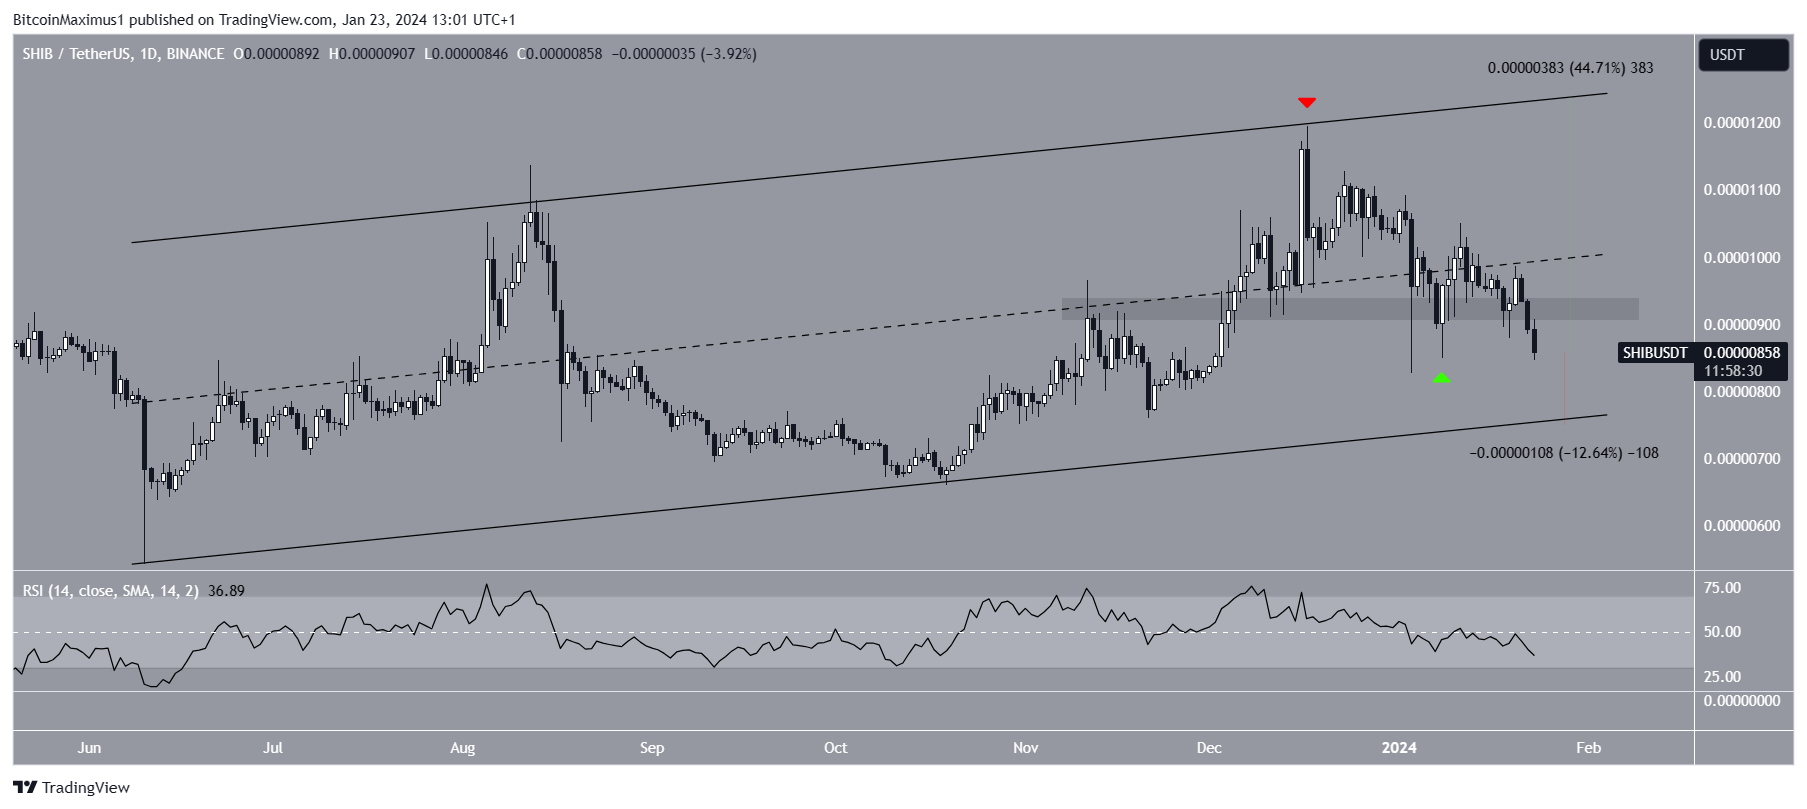
Shiba Inu (SHIB) price has pulled back from its short-term support but still manages to stay above its long-term support. Will this be enough to trigger a trend reversal, or will SHIB fall below its long-term support?
Momentum Fades for SHIB
Weekly technical analysis by cryptocurrency analysts shows that SHIB has failed to maintain its rise from November 2023. During that period, the Shiba Inu price had broken out from a descending resistance trend line that had been in place for about 500 days. The upward movement saw the altcoin’s price reach $0.000012 before starting to decline.
Since then, the SHIB price has retested the resistance trend line twice but failed to initiate any significant bounce despite trading above it. The weekly Relative Strength Index (RSI) is showing a downtrend but has not yet confirmed it. Investors use the RSI as a momentum indicator to assess whether a market is overbought or oversold and whether a token should be accumulated or sold.

Bearish Scenario for Shiba Inu
Additionally, the SHIB price has been trading within a rising parallel channel since June 2023. The upward movement led to a high of $0.0000120 in December. However, after facing rejection, SHIB experienced a decline. After trading above the $0.0000092 area for a short time, SHIB exited this region yesterday.
The popular meme token Shiba Inu price has fallen from its short-term support and is trying to stay above its long-term support. Weekly analysis by analysts shows that it failed to sustain its rise from November 2023, couldn’t break out from the descending resistance trend, and is under increasing selling pressure. The daily RSI, which is below 50 and declining, could support a bearish price movement. If the downward trend continues, experts believe SHIB could fall by 12%, reaching the channel’s support trend line at $0.00000800.

 Türkçe
 Español


