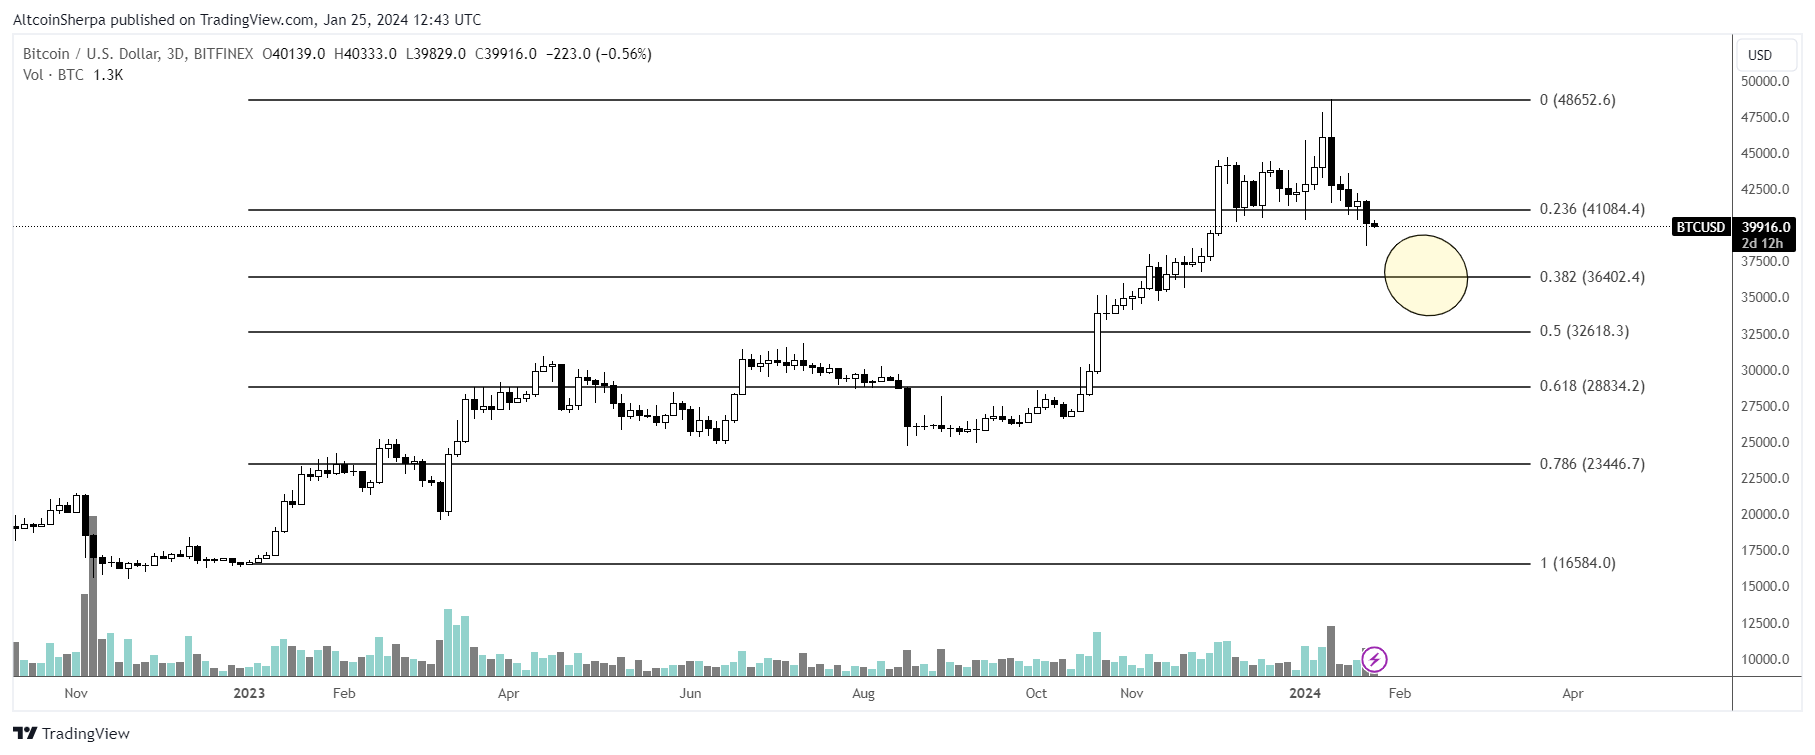
Bitcoin (BTC) price has significantly declined since January 11, trading below $40,000 this week. This downward movement is the second-largest drop since the beginning of 2023. Will the Bitcoin bleed continue?
Bitcoin Price Action
Technical analysts’ studies on the weekly timeframe indicate that the BTC price had increased since the beginning of 2023. The upward movement reached a level of $48,969 during the week the ETF was approved. However, BTC price later fell, forming a candlestick indicating a weekly price loss trend.
Bitcoin’s highest level occurred at the 0.618 Fib retracement resistance level. Bitcoin has fallen since then, retreating below $40,000 this week. The weekly Relative Strength Index (RSI) shows a downward trend. Investors use RSI as a momentum indicator to determine overbought or oversold conditions and decide whether to accumulate or sell a token.

Expert Commentary on Bitcoin
Readings above 50 and an uptrend suggest bulls still have the advantage, while readings below 50 indicate the opposite. The indicator has dropped below 70 and is moving downward. Crypto analysts and traders at X are mostly bearish on the short-term BTC trend. Altcoin Sherpa mentioned that BTC could fall to the 0.382 Fib retracement support level of $36,400. CredibullCrypto and TheTradingHubb, due to wave counting, suggest another low is on the way:
In my last video share, I wanted to review the LTF BTC count but forgot to mention it, here’s a chart. Also, it supports the idea of another small push down before we completely reverse.
However, IncomeSharks goes against the community consensus, suggesting that BTC could rise to $44,000 in the short term.

 Türkçe
 Español


