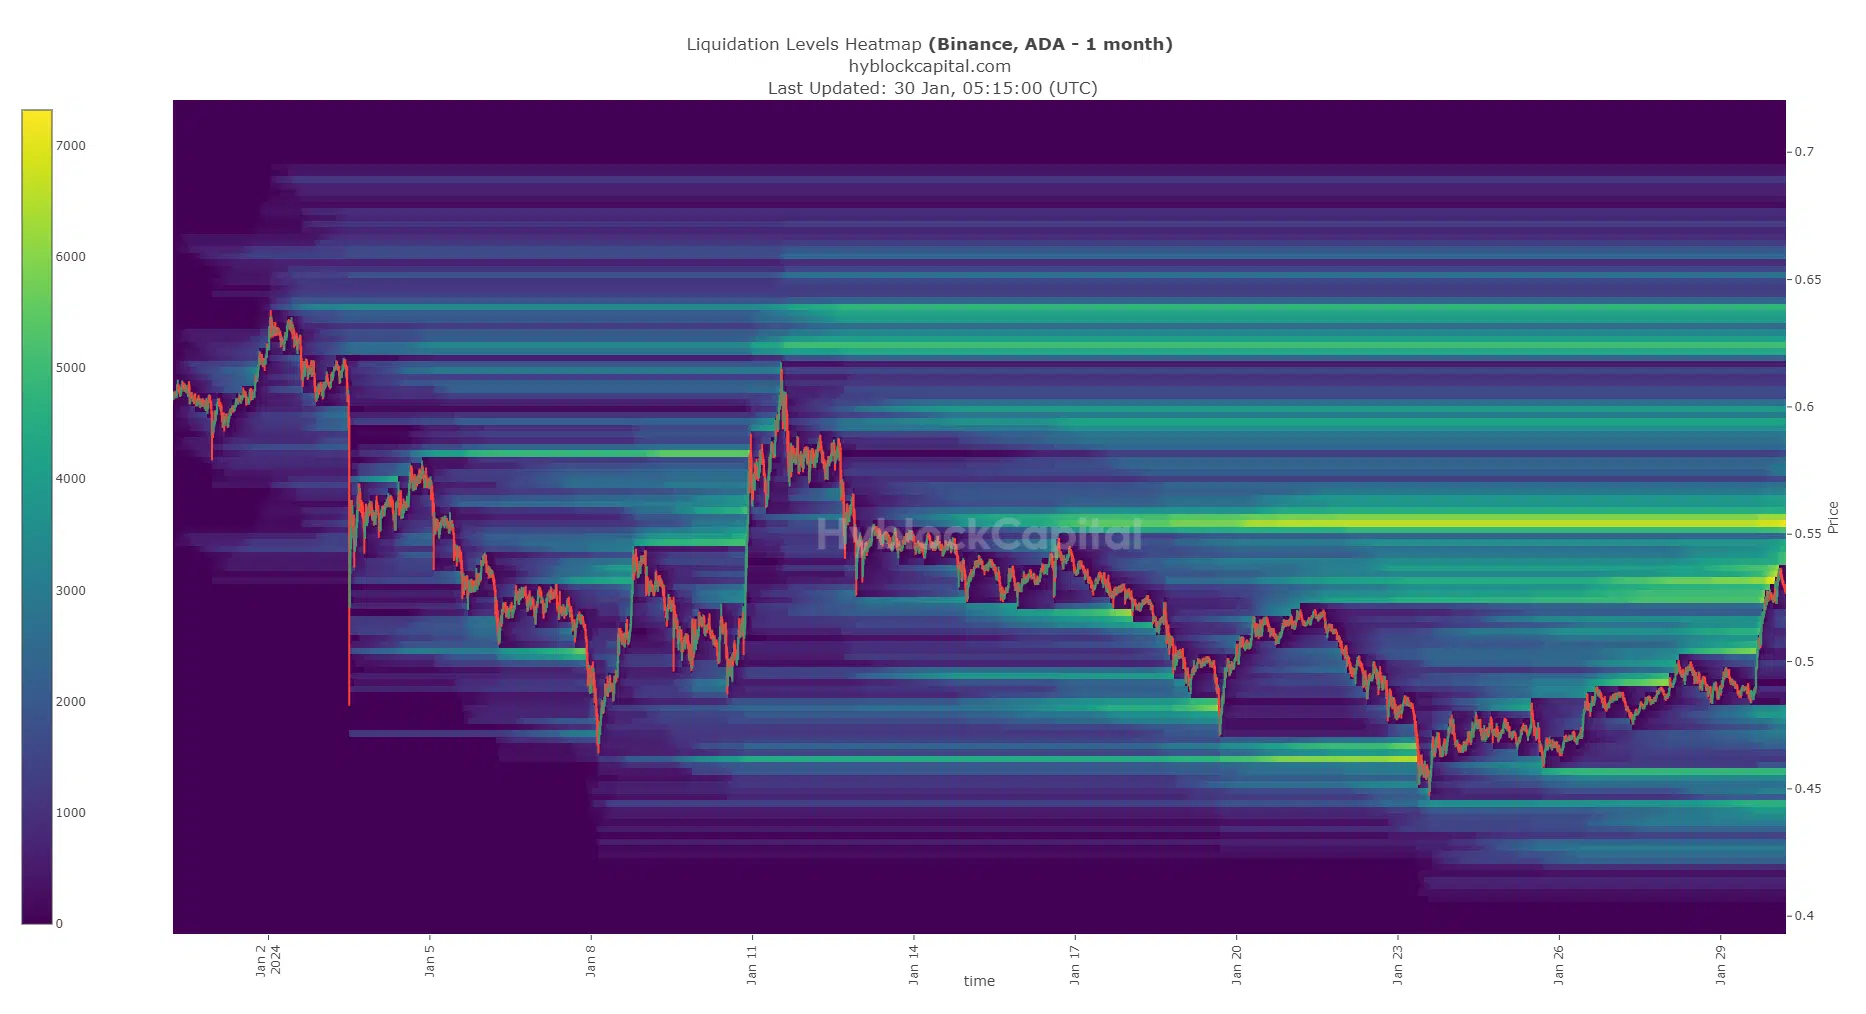
Cardano (ADA) fell below a six-week range on January 18th. It retested the $0.453 support level and recovered strongly. The lowest levels in the $0.51 range were once again turned into support, and liquidity prices close to $0.6 could be significant for this level.
Signs of a Price Increase in Cardano
ADA’s movement above $0.52 reversed the market structure on the 12-hour chart to bullish. Moreover, the move above the $0.524 resistance turned the level into support. These two metrics could indicate an uptrend for ADA in the coming days. The Relative Strength Index (RSI) moved above the neutral 50, signaling a potential change in momentum. The On-Balance Volume (OBV) has been in a downtrend since mid-December but saw a slight increase. However, the indicator may not yet be in a definitive uptrend.
This situation indicates that despite strong gains last week, the buying volume was only slightly stronger. Since the $0.524 level is now a support for Cardano, an increase in OBV can be expected. The cryptocurrency’s price action chart may show an imbalance and a downtrend block overlapping in the $0.56-$0.57 region. This could mean a tough resistance area that bulls may take some time to overcome.

The State of Bulls in ADA
Hyblock’s predicted liquidation levels heat map data was analyzed. This data could be consistent with findings from price movements. Initially, ADA entered the $0.524-$0.536 region, reducing significant liquidity. This could be followed by a minor retracement towards $0.51 as bulls solidify their positions. The liquidity heat map showed levels between $0.554 and $0.564. The $0.6 and $0.62 regions could likely attract ADA prices towards them.
Compared to this, the upward liquidation levels might be insufficient. Therefore, an upward move could be much more likely than a drop towards $0.46-$0.47. If bulls can scale the $0.57 resistance, reaching the $0.62 level could be expected. This could be because it represents a local high level where significant liquidity might be present.

 Türkçe
 Español


