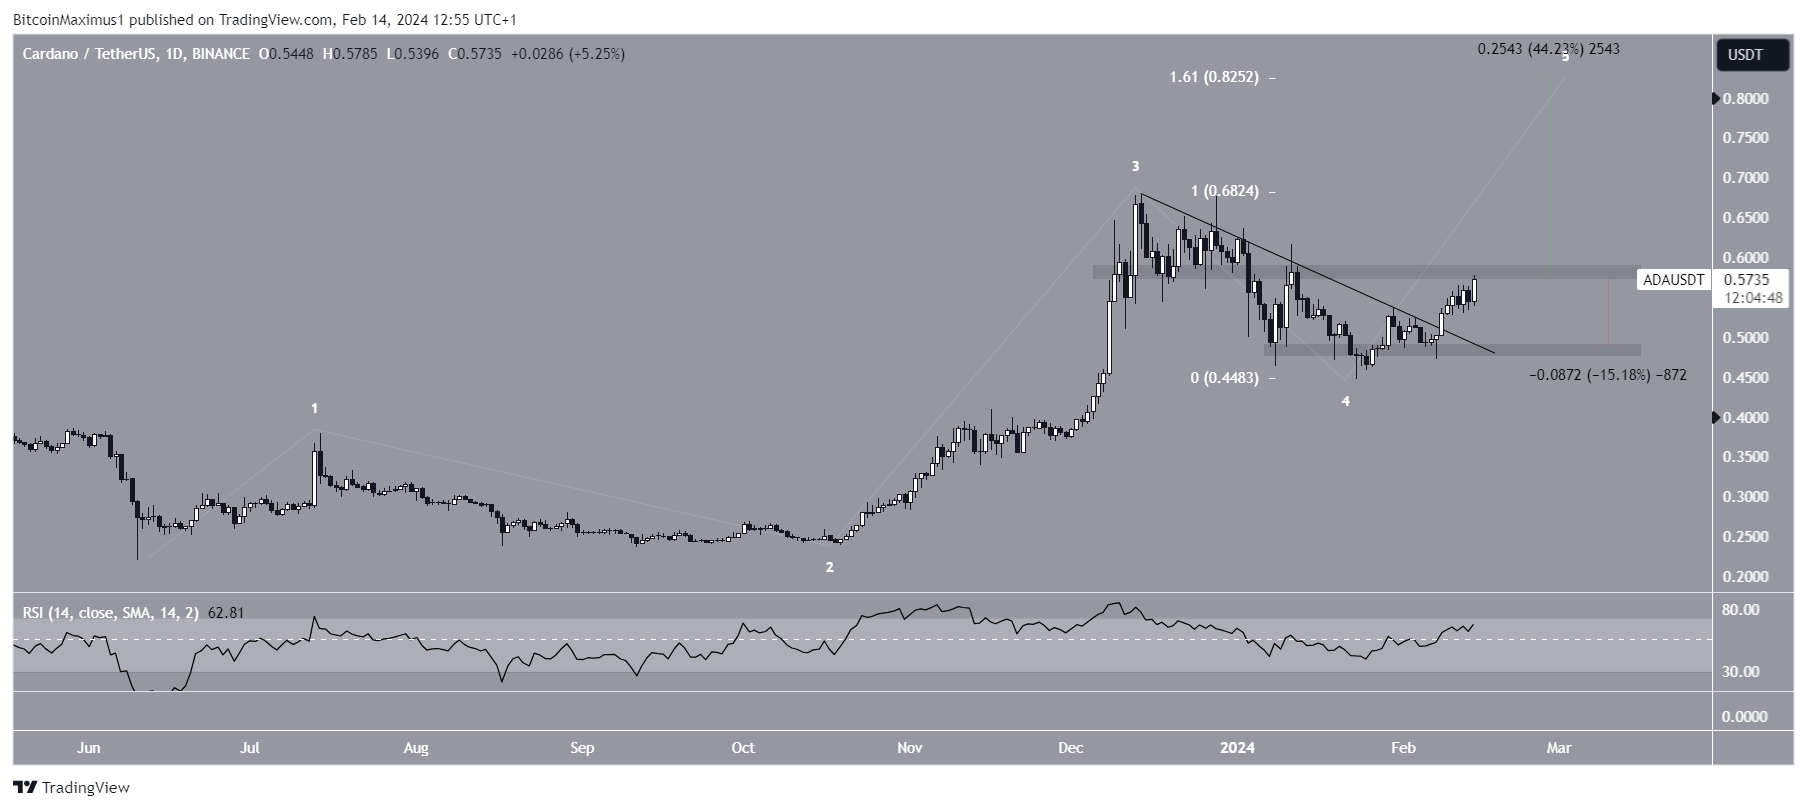
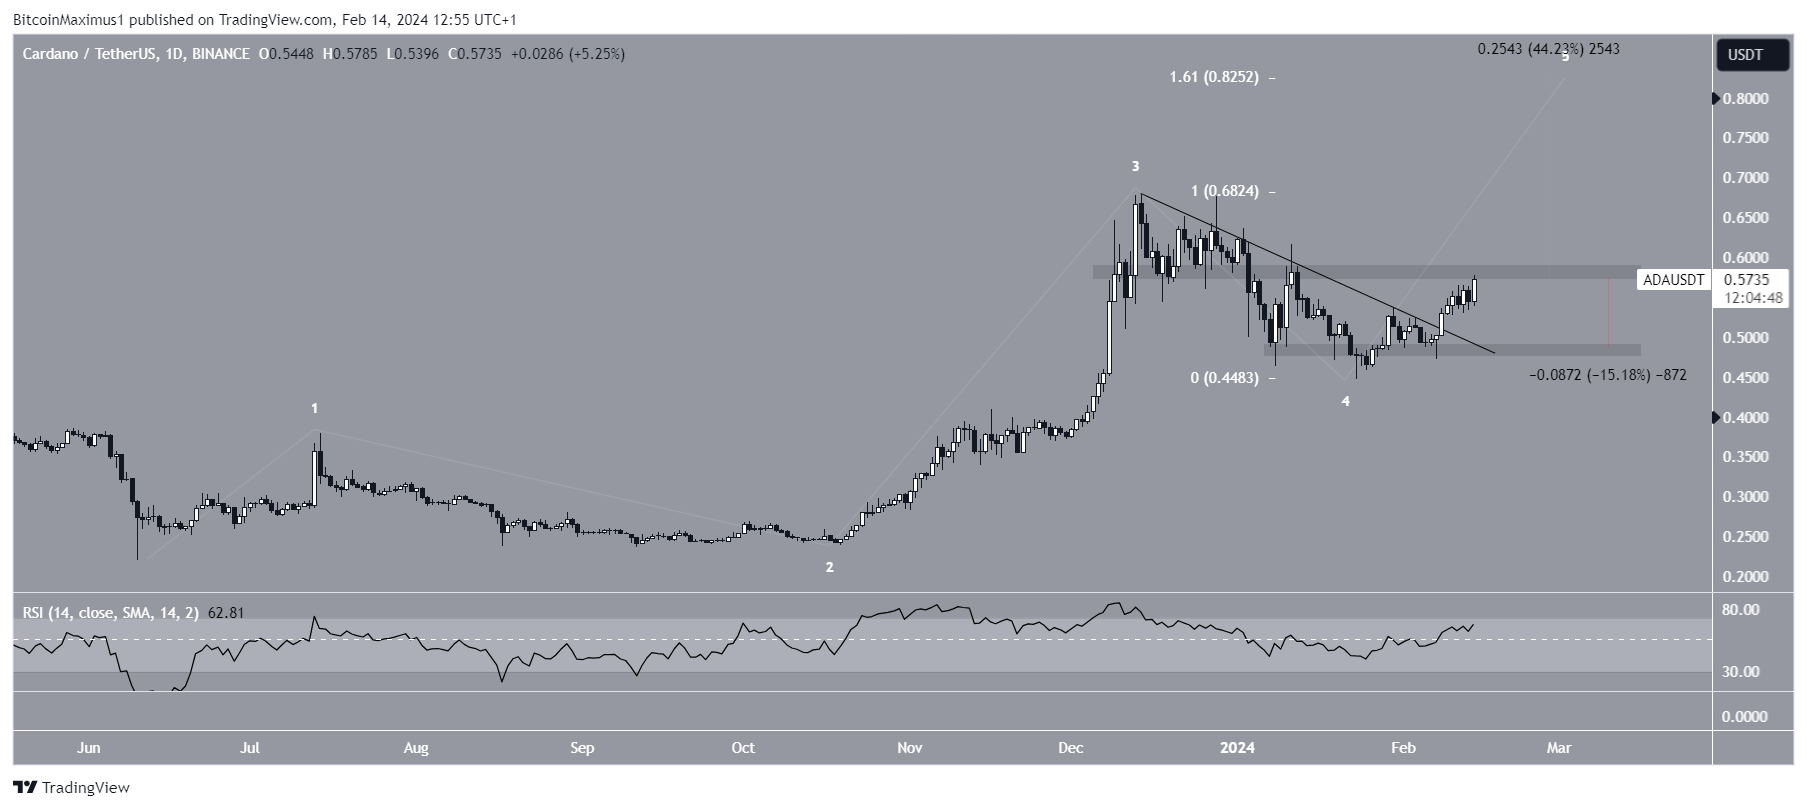
Cardano price has been trying to break out from the horizontal resistance that has been in the spotlight for about three months. ADA has successfully exited the short-term descending resistance trend line. But can the rise take it above the long-term horizontal resistance? Weekly chart technical analysis shows that Cardano’s price has been rapidly increasing since October. This upward movement resulted in a new yearly high of $0.68 in December 2023.
Weekly ADA Chart Analysis
Despite the increase, ADA has not been able to exit the long-term horizontal resistance area. Instead, it formed five consecutive long upper wicks (red dots), which are considered signs of selling pressure. After about a month of decline, ADA is on the rise again, trying to break out from the long-term resistance area.
The Weekly Relative Strength Index (RSI) is on an upward trend. As investors evaluate market conditions, the RSI level continues to be used as an important momentum indicator.
If the RSI value is above 50 and the trend is upward, investors still have the advantage, but if the value is below 50, the opposite is true. The RSI continues to rise above 50 and is almost reaching over 70. All these can be considered signs of a bullish trend.

Daily ADA Chart Analysis
The daily chart technical analysis presents a bullish outlook. The chart shows that ADA initiated an upward movement by breaking out of a descending resistance trend line on February 8th. The rise was combined with an RSI increase above 50, which triggered the movement.
Elliott Wave theory involves the analysis of recurring long-term price patterns and investor psychology to determine the direction of a trend, and wave counting also supports the ongoing increase. The most likely count indicates that ADA is in the fifth and final wave of an upward movement that started in June 2023.
If the count is correct, the first target for the peak of the increase is the $0.83 level found with the 1.61 external Fib retracement of the fourth wave, and this target is 45% above the current ADA price. However, failure to close above the $0.58 horizontal resistance area could trigger a 15% drop to the nearest support at $0.48.


 Türkçe
 Español


