Cryptocurrencies have been showing a remarkable bull rally in the last two days, led by Bitcoin (BTC) and Ethereum (ETH). The total market capitalization of crypto markets has risen above the $2 trillion level for the first time in years.
RSI and the Expectation of Corrections
While all this is happening, charts reflect that some cryptocurrency projects have entered into overbought territory according to their Relative Strength Index (RSI). Due to the overbought condition, some investors may decide to be content with their earnings in the coming days and sell to turn their significant gains into profits.
If a certain number of investors decide to realize their profits, these overbought cryptocurrencies could face a sharp pullback or correction. Therefore, by identifying extreme price movements during this period, investors can be helped to preempt these corrections and avoid significant losses. In this context, CoinGlass’s RSI heat maps were examined on February 27th for information.
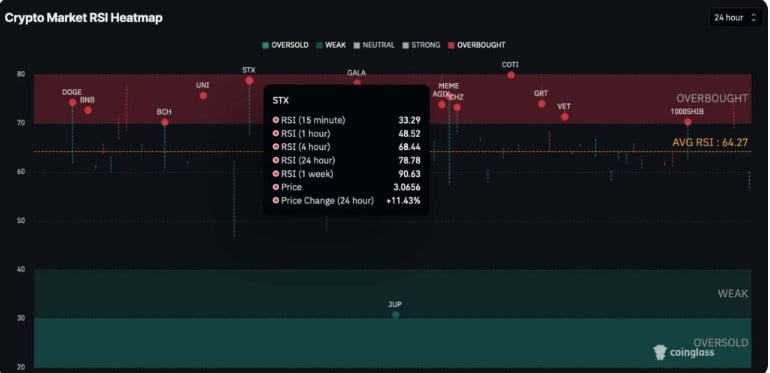
Stacks (STX) and Its Current Status
Among the cryptocurrencies to be examined was Stacks (STX), which saw an increase of 11.43% in the last 24 hours, trading at $3.06 at the time of writing. Stacks is positioned as a Layer-2 solution and followed BTC during its price rally.
This resulted in STX having the second-highest daily RSI value among all cryptocurrencies, with a figure of 78.78. Moreover, looking at the weekly index, the value pointed to 90.63, indicating that investors’ overbuying had almost reached the maximum level in Stacks, which could also be considered a sell signal.
Measurements indicating a lower price range could pave the way for a price correction. Upon closer inspection, STX’s hourly RSI value was pointing to 48.52.

Will Coti (COTI) Undergo a Correction?
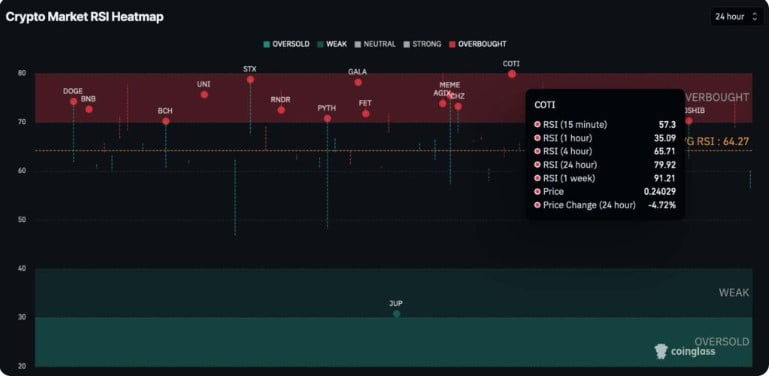
Secondly, Coti (COTI) found its place on this list and stands out as a cryptocurrency with a lower market value compared to its competitor. The token experienced a 4.72% decrease within the day, finding buyers at $0.24.
Specifically speaking about COTI, it was seen leading STX with RSI values of 79.92 and 91.21 for daily and weekly time frames, respectively. Looking at the price, there was talk of a potential correction starting, along with a strong sell signal for crypto investors.

On the other hand, it would be useful to say that the average daily RSI at the time of writing is also high. While the RSI value of 64.27 indicates that the buying momentum in cryptocurrencies continues, it could reflect the possibility of continued price increases despite the feeling that sales could begin.

 Türkçe
 Español


