The rising momentum in the crypto market has led to the prominence of several altcoin projects, including Bitcoin. The lively days in memecoin projects continue to attract the attention of many investors. So, what is happening on the fronts of Cardano, Dogecoin, and Shiba Inu, which investors are closely monitoring during this period? We are examining with detailed chart analysis and important levels.
Cardano Chart Analysis
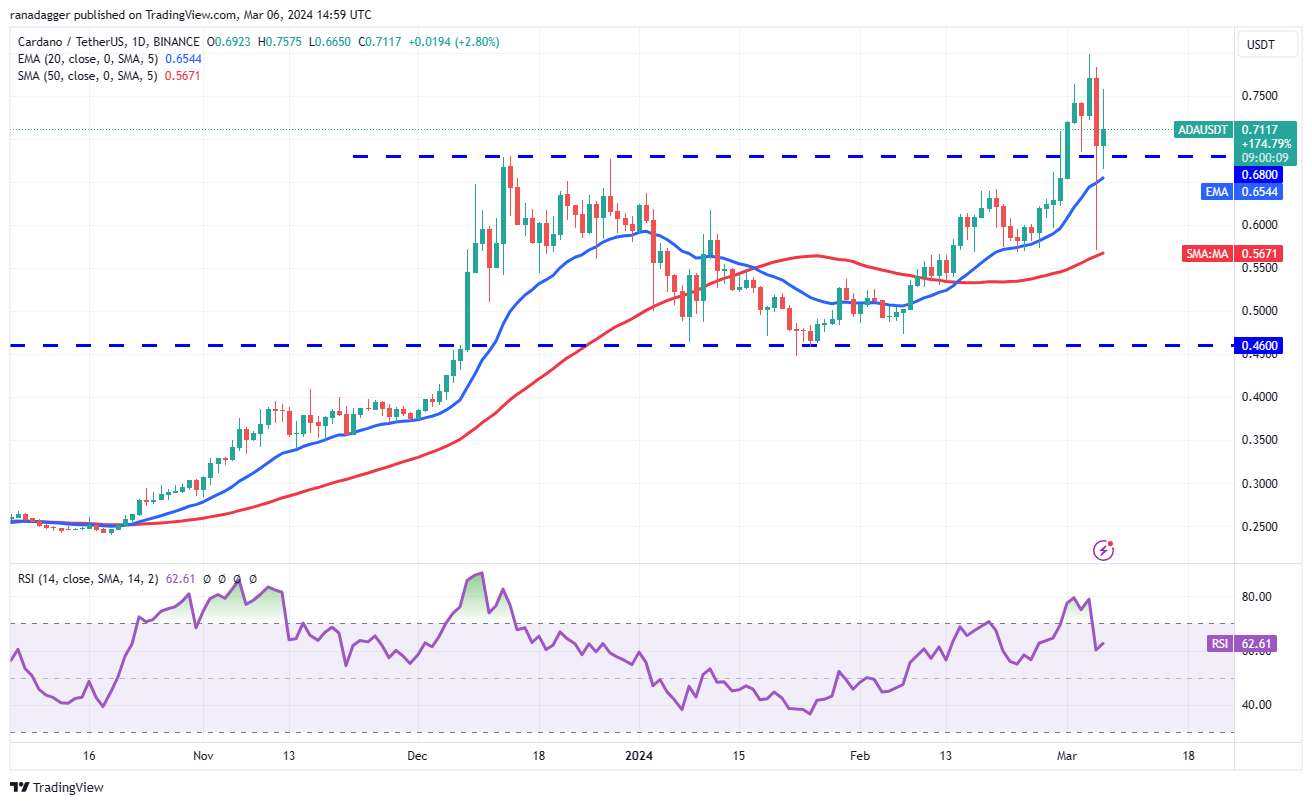
Cardano began to decline from $0.80 on March 4th and retreated to the 50-day SMA average of $0.56 on March 5th. However, the bulls aggressively bought the dip near the 50-day SMA average, and the price recovered to close above the breakout level of $0.68. This indicates a bullish inclination among investors. If the price rises from the current level, the ADA/USDT pair could reach the overall resistance of $0.80.

Conversely, if the price falls and closes below the 20-day EMA average of $0.65, this positive scenario would be invalidated. The pair could then drop to the 50-day SMA average.
Dogecoin Chart Analysis
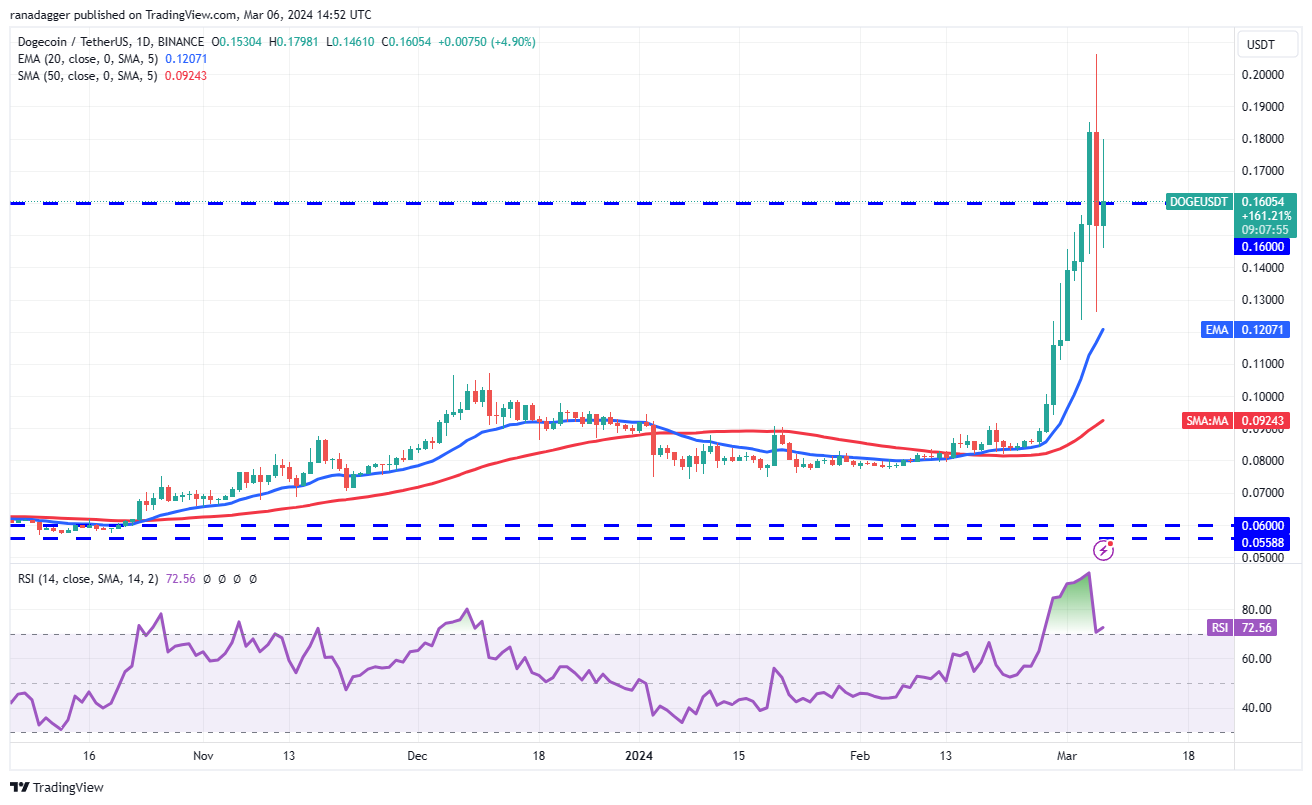
Dogecoin broke above the $0.16 resistance on March 4th but could not sustain the breakout on March 5th, indicating profit booking at higher levels. Bulls are struggling to keep the price above $0.16, suggesting continued selling during rallies. If the price turns down from the current level or overall resistance, the DOGE/USDT pair could fall to the 20-day EMA average of $0.12, where buyers might step in.

On the other hand, if buyers keep the price above $0.16, the pair could gradually retest the local high of $0.20. A break and close above this level could signal the start of the next leg of the uptrend to $0.30.
Shiba Inu Chart Analysis
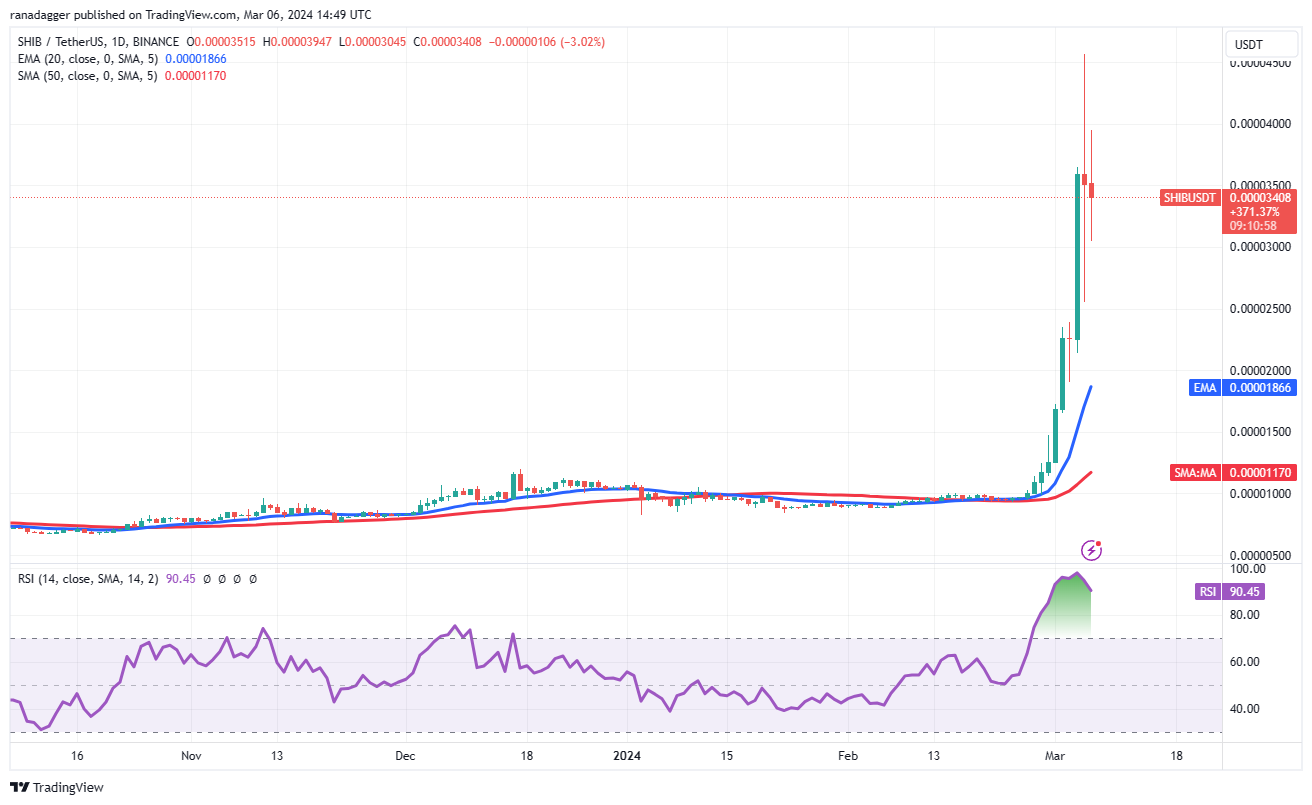
Shiba Inu has been in a strong bull run over the past few days. Bulls pushed the price to $0.000045 on March 5th, but as the long wick on the candlestick shows, they could not sustain higher levels. This triggered a sell-off that brought the price down to $0.000025. A small positive for the bulls is that the lower levels were aggressively bought up, indicating solid demand on dips.

After a wide-ranging day, the SHIB/USDT pair may remain range-bound for a few days. The boundaries of the range could be $0.000025 on the downside and $0.000045 on the upside. The overbought level on the RSI also warns of a possible correction or consolidation in the near term.

 Türkçe
 Español


