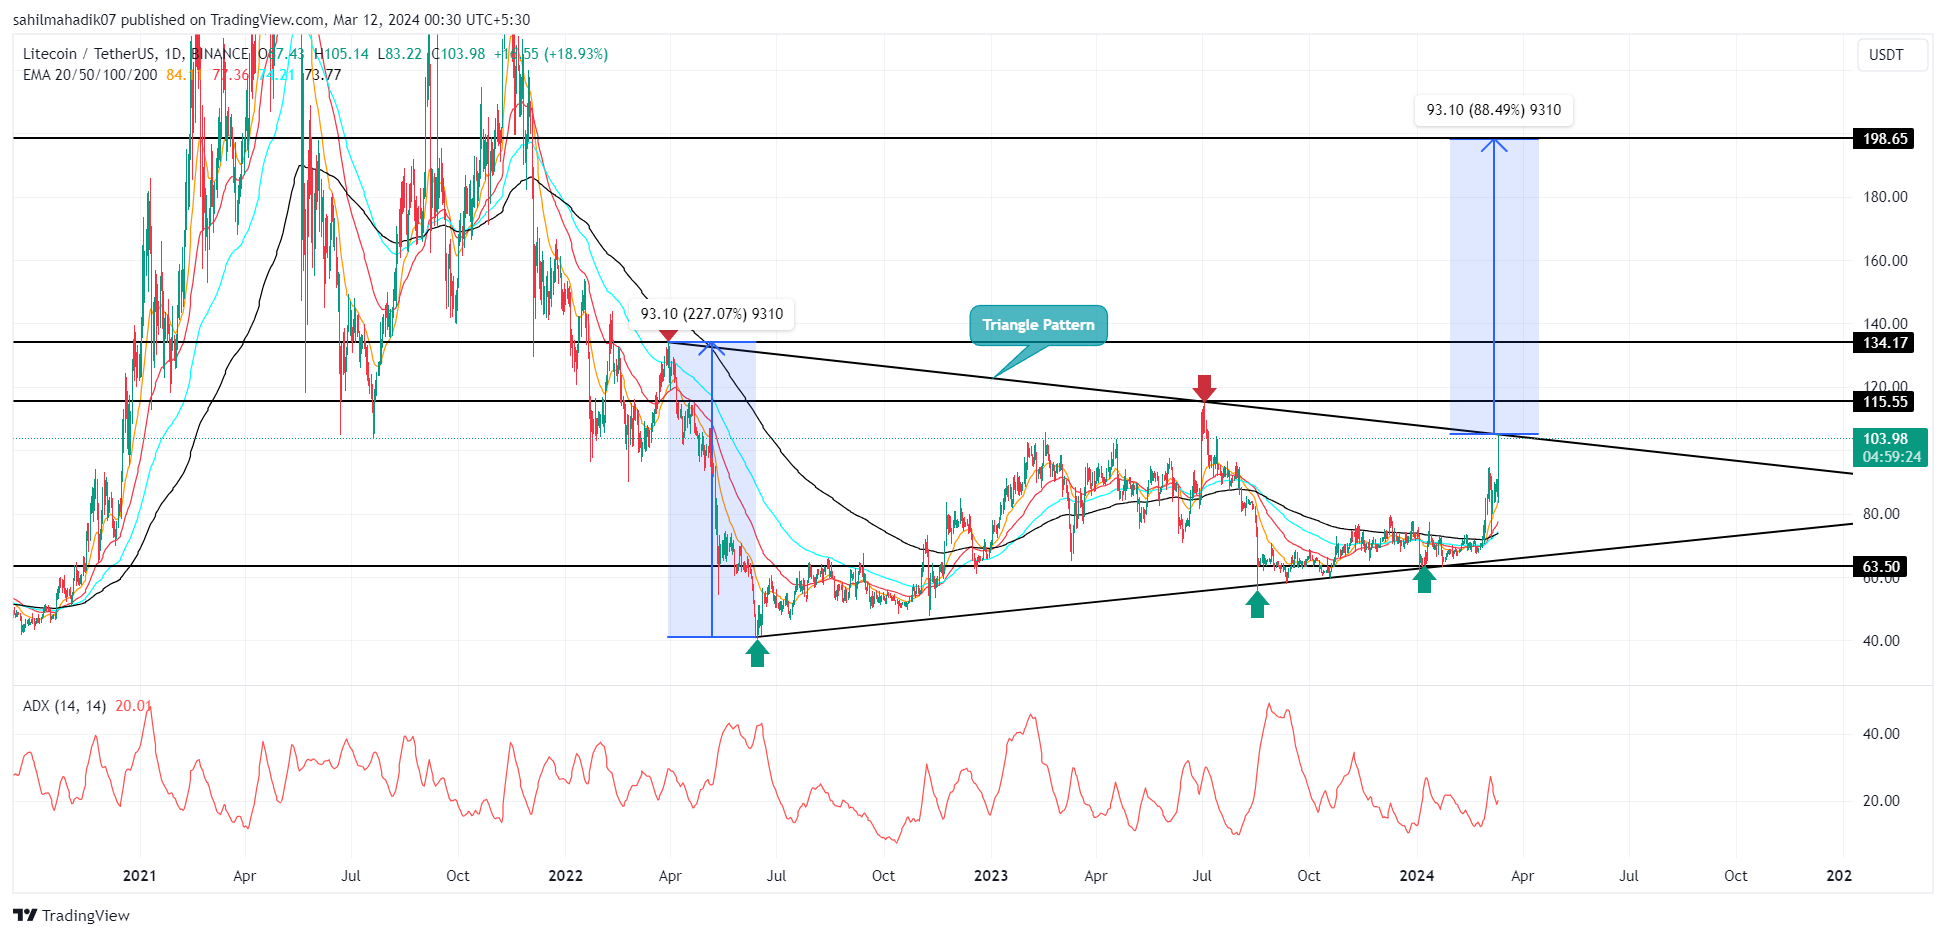
Cryptocurrency market expanded its recovery with the new week as Bitcoin price reached the $72,000 level for the first time. The rise in momentum spread to the altcoin market as well, pushing many cryptocurrencies including Litecoin to new levels. During the day, with a 20% gain, LTC price surpassed the $100 mark, challenging the resistance trend line of a 2-year horizontal trend.
Critical Formation in Litecoin
Litecoin (LTC) aims to provide faster transaction confirmation times and a more efficient mining process. Litecoin is often regarded as the silver to Bitcoin‘s gold and can emphasize its role as a practical medium of exchange for daily transactions. The current recovery trend in Litecoin began with the price rebounding from the $63 consolidated support and the lower trend line of a symmetrical triangle pattern.
Under the influence of the mentioned model, the token resonates between two converging trend lines until one breaks and signals the next directional move. Thus, under the influence of this model and the broader market recovery, Litecoin’s price increased by 66% over seven weeks, reaching the current trading price of $105. This bull cycle is now challenging the triangle formation’s resistance trend line and could signal the opportunity to trigger a new recovery trend.

Analytical Reports on LTC
Looking at the daily time frame chart, a long bullish candlestick that crosses the general trend line by 20% is observed. According to the derivative market data provider Coinglass, Litecoin witnessed a liquidation of $2.17 million in short positions. Therefore, a successful breakout could signal the end of the 2-year horizontal movement and provide buyers with the appropriate support to sustain the recovery. The theoretical target suggests that the rally following the breakout should pursue $200. However, a possible retracement from the resistance trend line could extend the current horizontal trend in Litecoin.


