Polygon (MATIC) is among the first few altcoins to officially enter a downtrend, and losing $1 in value may not be far off as MATIC’s rate of decline increases. At the time of writing, Polygon’s price had fallen from $1.26 to $1.05.
Indicators Point to a Decline in MATIC
MATIC has dropped below multiple support levels and the 50-day Exponential Moving Average (EMA). The altcoin is currently just under 6% above the $1.00 price point. Technical indicators such as the Relative Strength Index (RSI) and Moving Average Convergence Divergence (MACD) are showing a bearish trend. RSI measures the velocity and change of price movements, indicating potential overbought or oversold conditions. MACD evaluates the trend momentum by comparing the price’s two moving averages, often used to identify buying or selling signals.
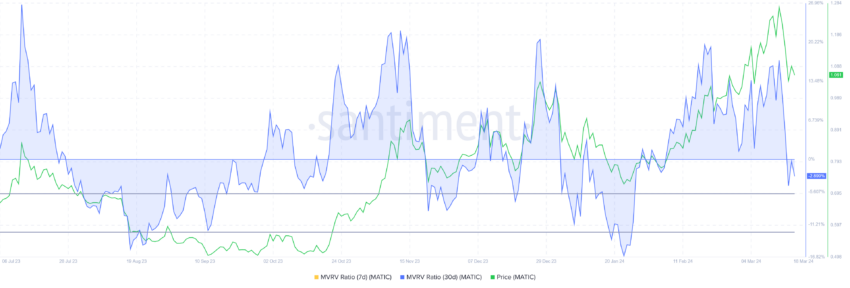
When combining these two data points, it becomes clear that the signal is towards selling, as both are in their respective negative/declining zones. Additionally, the Market Value to Realized Value (MVRV) ratio is currently below the zero line, which indicates a strong sell signal. The MVRV ratio is an important indicator for assessing the average profit or loss of investors who have acquired a token.

“Opportunity Zone” in MATIC
Specifically, the 30-day MVRV ratio can assess the average profit or loss of investors who acquired the asset in the previous month. For instance, in the case of Polygon, a 30-day MVRV ratio of -3% indicates that investors who bought MATIC last month are now observing a 3% loss. Historical data in the cryptocurrency unit can show that when the MVRV value drops between -5% and -12%, it often precedes market upswings.
This particular range can be referred to as the “opportunity zone,” representing an ideal scenario for token accumulation. However, MATIC is still slightly above this zone, which could mean it may record further declines before becoming an ideal token for accumulation.

 Türkçe
 Español


