NEAR experienced a significant price correction recently, resulting in reduced trading activity since its peak on March 3rd, and the Relative Strength Index (RSI) also declined but remained above the overbought threshold. The price chart indicates a potential bearish trend with an impending death cross signal.
What’s Happening with NEAR?
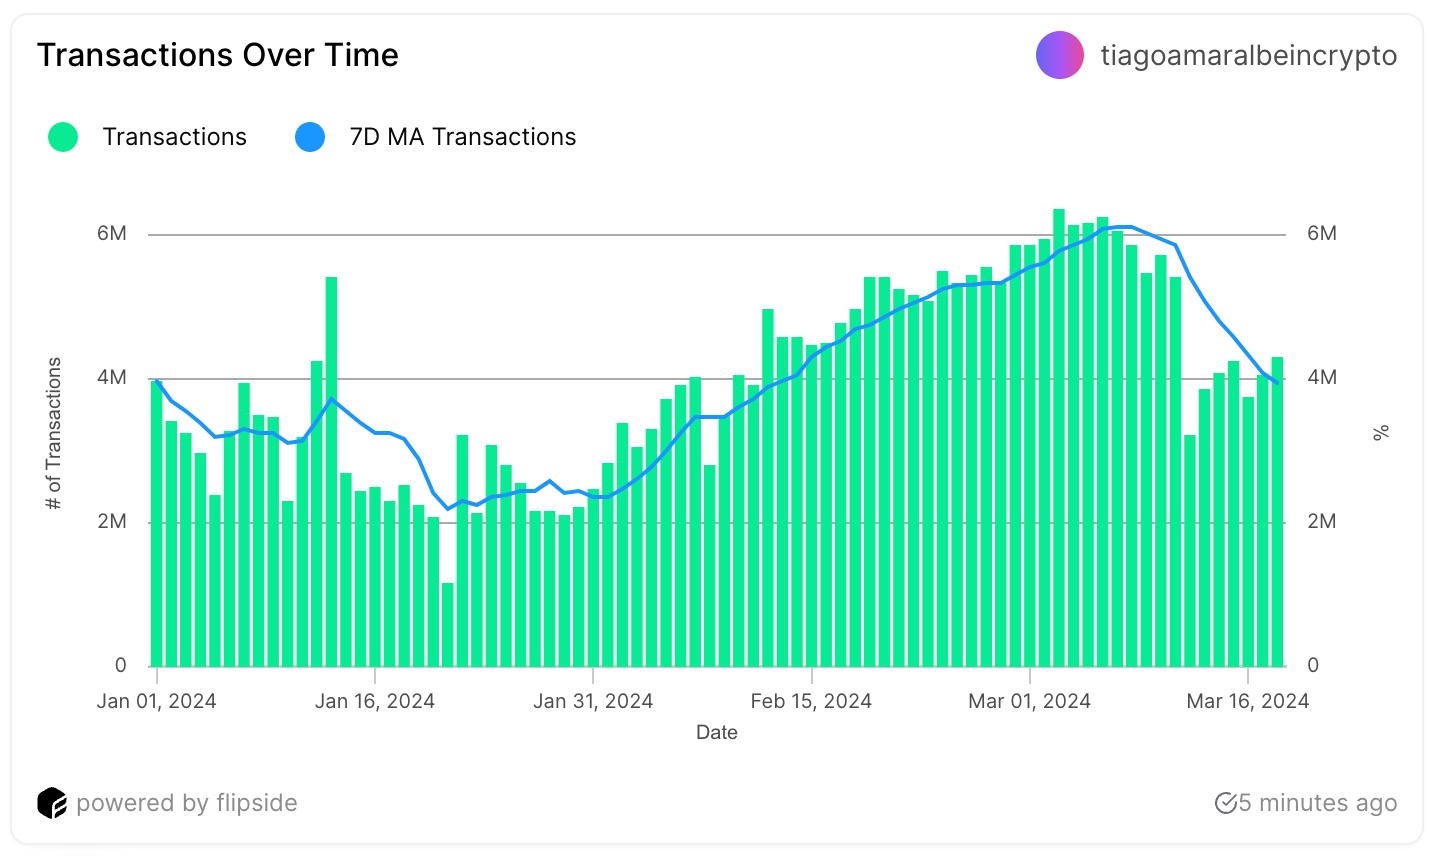
After reaching a peak of over 6 million daily transactions on March 3rd, the volume has started to decrease over the past two weeks. This peak was the highest daily transaction count for the NEAR protocol since December 29, 2023, and the second-highest to date. When the transaction count began to increase daily from February 1st to March 3rd, the NEAR price followed suit. During the same period, the NEAR price surged by 68.77%, climbing from $2.85 to $4.81.

Following the peak on March 3rd, the 7-day Moving Average indicates a slowdown in transactions. Interestingly, the NEAR price continued to rise, climbing from $4.13 to $8.94 as of March 14, marking a 116.46% increase. This suggests that NEAR’s price movement is not closely following its fundamentals in the current crypto market climate. The 11-day rapid price increase could be attributed to broader crypto market growth.
NEAR and Key Data Points
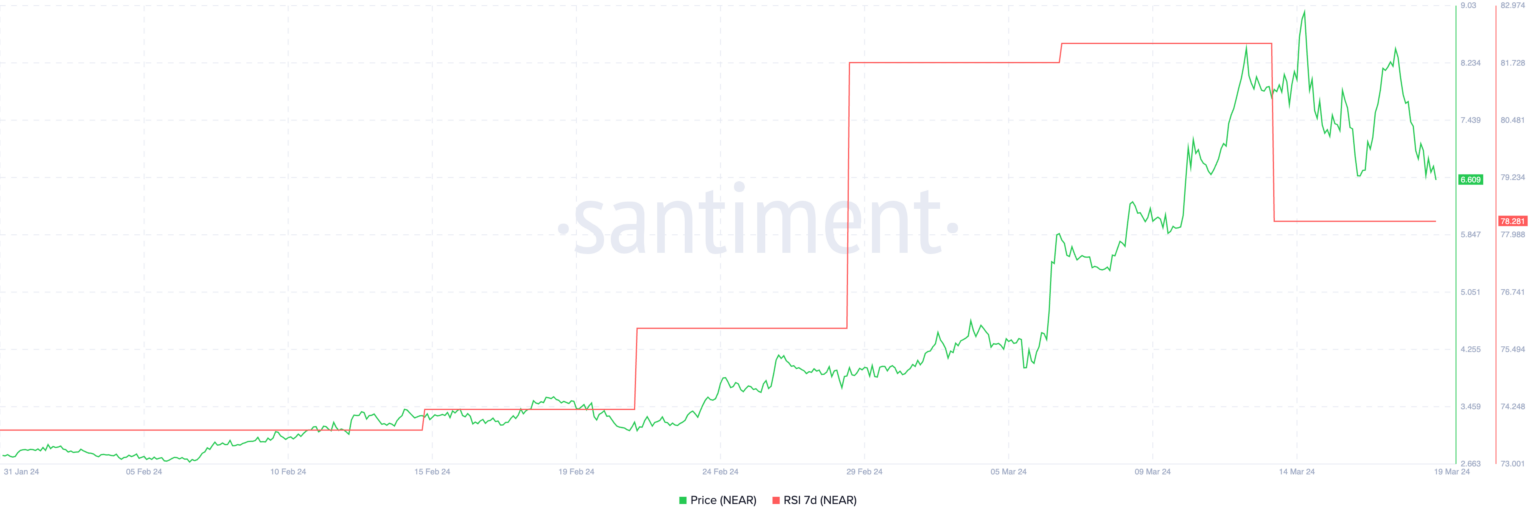
NEAR‘s RSI level remained above 80 from February 29th to March 13th, coinciding with the price surge. However, a correction began, and the NEAR price dropped from $8.84 to $6.6 within four days. The current RSI level for NEAR is at 78. A decrease in RSI from 82 to 78 indicates a slight decline in the momentum of price increases. An initial RSI value of 82 suggests that NEAR might have been potentially overbought, indicating that its price might have risen too quickly, and investors could start taking profits, leading to a correction or pullback.

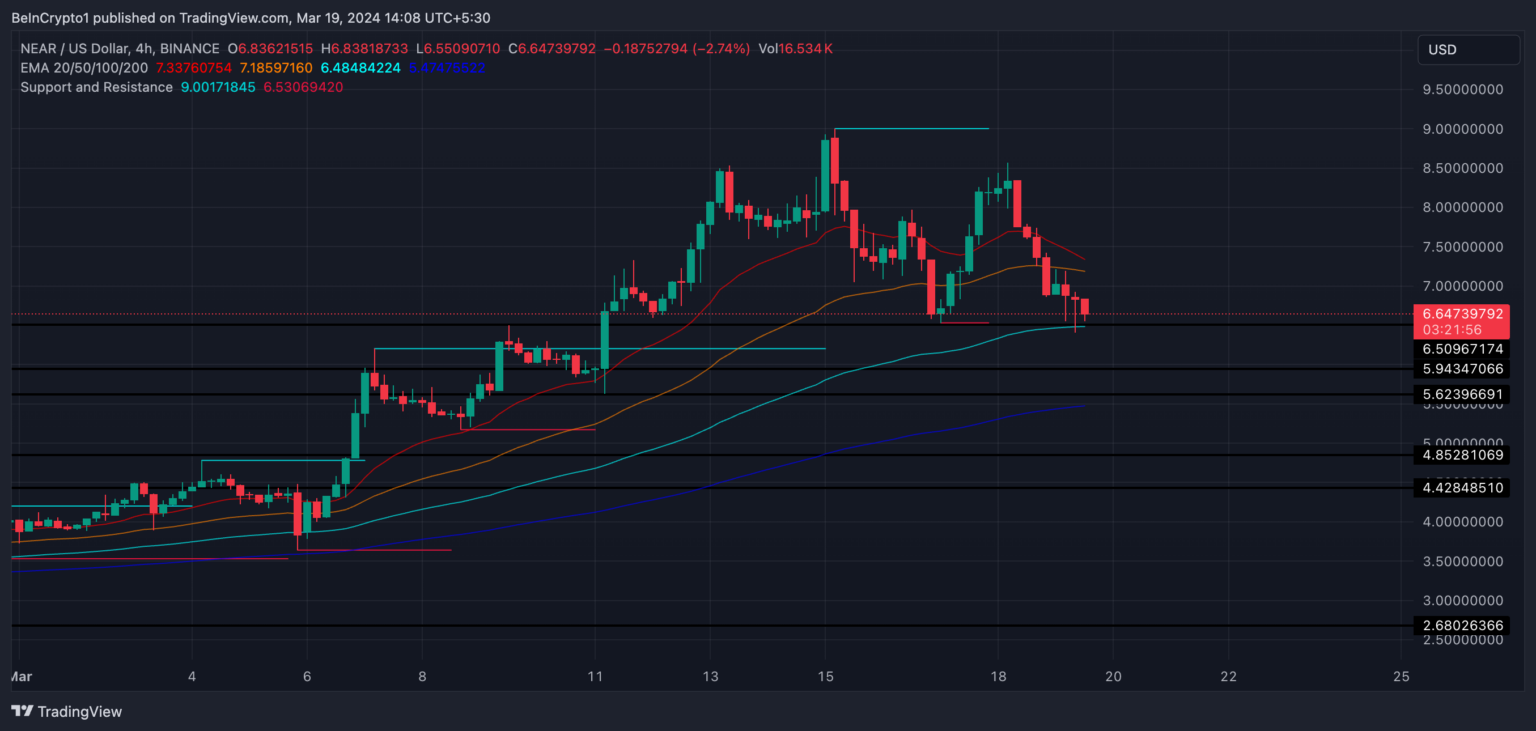
Exponential Moving Averages (EMAs) are trend indicators that give more weight to recent price data. They are used to smooth out price action and determine the direction of the trend over a certain period. This could indicate a shift from an uptrend to a downtrend, aligning with the potential price movements discussed.

NEAR price analysis shows that the $5.13 level serves as a significant support zone. If NEAR fails to maintain this support, we could see a drop towards $3.64, which would represent a potential decrease of about 45% from the current price of $6.64. If there is a reversal in the current trend, NEAR could return to the $9 level, which would mean a potential increase of approximately 35%.

 Türkçe
 Español


