Crypto analysis firm Glassnode believes that Bitcoin (BTC) has entered a period of market correction and price fluctuation following this year’s major rally.
Glassnode Issues Statement
In a new YouTube video released by the analysis firm, it was indicated that investors are selling to take profits after Bitcoin’s 175% rise this year and reaching an all-time high this month, which shows that fundamental indicators are suggesting Bitcoin is “taking a breath.”
When I look at the general market structure at different stages, we shouldn’t be surprised if the market is entering some sort of correction here. It makes sense because there’s enough green in everyone’s portfolio and historically speaking, people start taking profits.
We can see this in the supply of long-term holders who have actually realized a significant amount of profit. We saw that the long-term supply decreased within seven days and the realized profits reached an all-time high of 3.5 billion dollars daily.
This means we need to make an entry into the asset worth 3.5 billion dollars to get these new coins. Now, these are quite significant figures, but we are also talking about a world after the ETF (Bitcoin exchange-traded fund). We’re talking about hundreds of millions to billions of dollars now.
Is It Time for a Bitcoin Correction?
The firm pointed out that two key indicators are signaling a potential Bitcoin correction during this period.
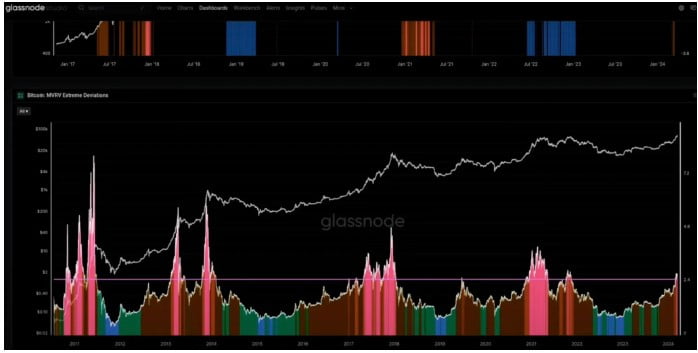
According to Glassnode, the market value to realized value (MVRV) ratio, which is the ratio of Bitcoin’s market value to the realized value (the price value that emerges after all BTCs are purchased), is showing conditions of a possibly overvalued market.
Another indicator Glassnode highlighted is the Active-Value-Investor-Value (AVIV) ratio. Similar to the realized price but excluding inactive coins like lost ones, the AVIV ratio is also being examined. Bitcoin’s price movements are increasingly diverging from the metric’s midpoint, and according to the analysis firm, this indicates a possible correction.

At this point, it makes sense for us to hit a snag, and as you can see in the AVIV ratio, we are entering a more volatile period. Historically speaking, the market can rise quite sharply, but then it can correct almost as sharply as we see in our MVRV and AVIV ratios. Therefore, there’s something we need to keep in mind, and we use it to frame where we are in the cycle, where we can start to expect resistance to kick in.

 Türkçe
 Español


