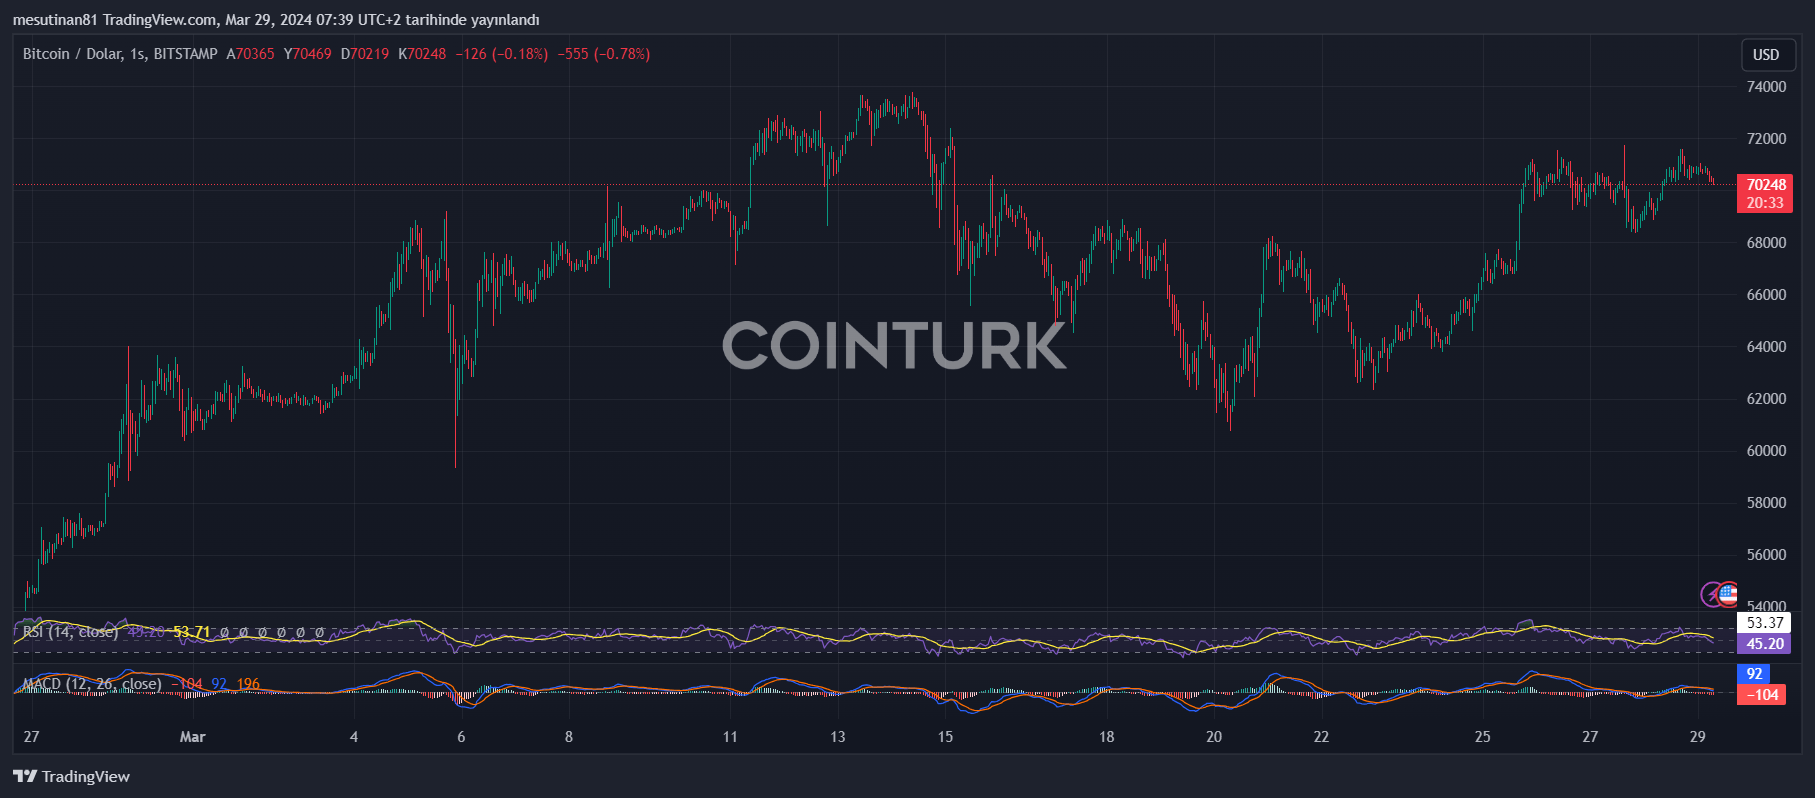
The cryptocurrency Bitcoin is giving hope to its investors by pushing its price above the $70,000 resistance zone. The BTC/USD pair is gaining solid momentum above the $71,500 resistance level, preparing to continue its upward trend. However, it first needs to break through the $71,000 mark.
Bitcoin Price Stands Above $70,000
According to recent data, Bitcoin‘s price is trading around $70,250 and is above the 100-hour Simple Moving Average. On the hourly chart of the BTC/USD pair, a significant support level has been established at $70,200. This support level forms an important uptrend line that is bolstering Bitcoin’s rapid ascent.
Bitcoin’s price has recently found solid support above the $69,000 resistance zone. This support has enabled BTC to move back into a positive region and rise above the $70,000 resistance zone.
During the day, Bitcoin’s price exceeded the $71,000 level and tested the $71,500 resistance level. However, even though slight corrections at these levels are normal, BTC’s overall upward trend cannot be ignored. Currently, Bitcoin has formed a strong resistance level above $70,000, and surpassing the $71,500 resistance zone in the near term could signal the start of a new rally.
In potential Bitcoin price increases, significant resistance levels at $72,500 and then $73,500 should be monitored.
If BTC Fails to Break Key Resistance
If the cryptocurrency fails to break above the $71,500 resistance level, a downward trend could likely begin. So, what signs are there?
Looking at immediate support levels, we see that BTC is near the $70,200 level and the trend line. However, the point of interest is the 50% Fibonacci retracement level of the upward move from $70,000 to $68,468, which is $71,539. If a close below $69,200 occurs, it is anticipated that the price could initiate a decline towards the $68,000 level. In this case, further losses could lead the price towards the support zone of $66,500 in the near term.

Looking at technical indicators, we observe that the hourly MACD is gaining momentum. The hourly RSI (Relative Strength Index) for BTC/USD is above the 50 level, which provides some optimism.
However, the main support levels to watch in the market are $70,200 and $69,200. The resistance levels are set at $71,200, $71,500, and $73,500.


