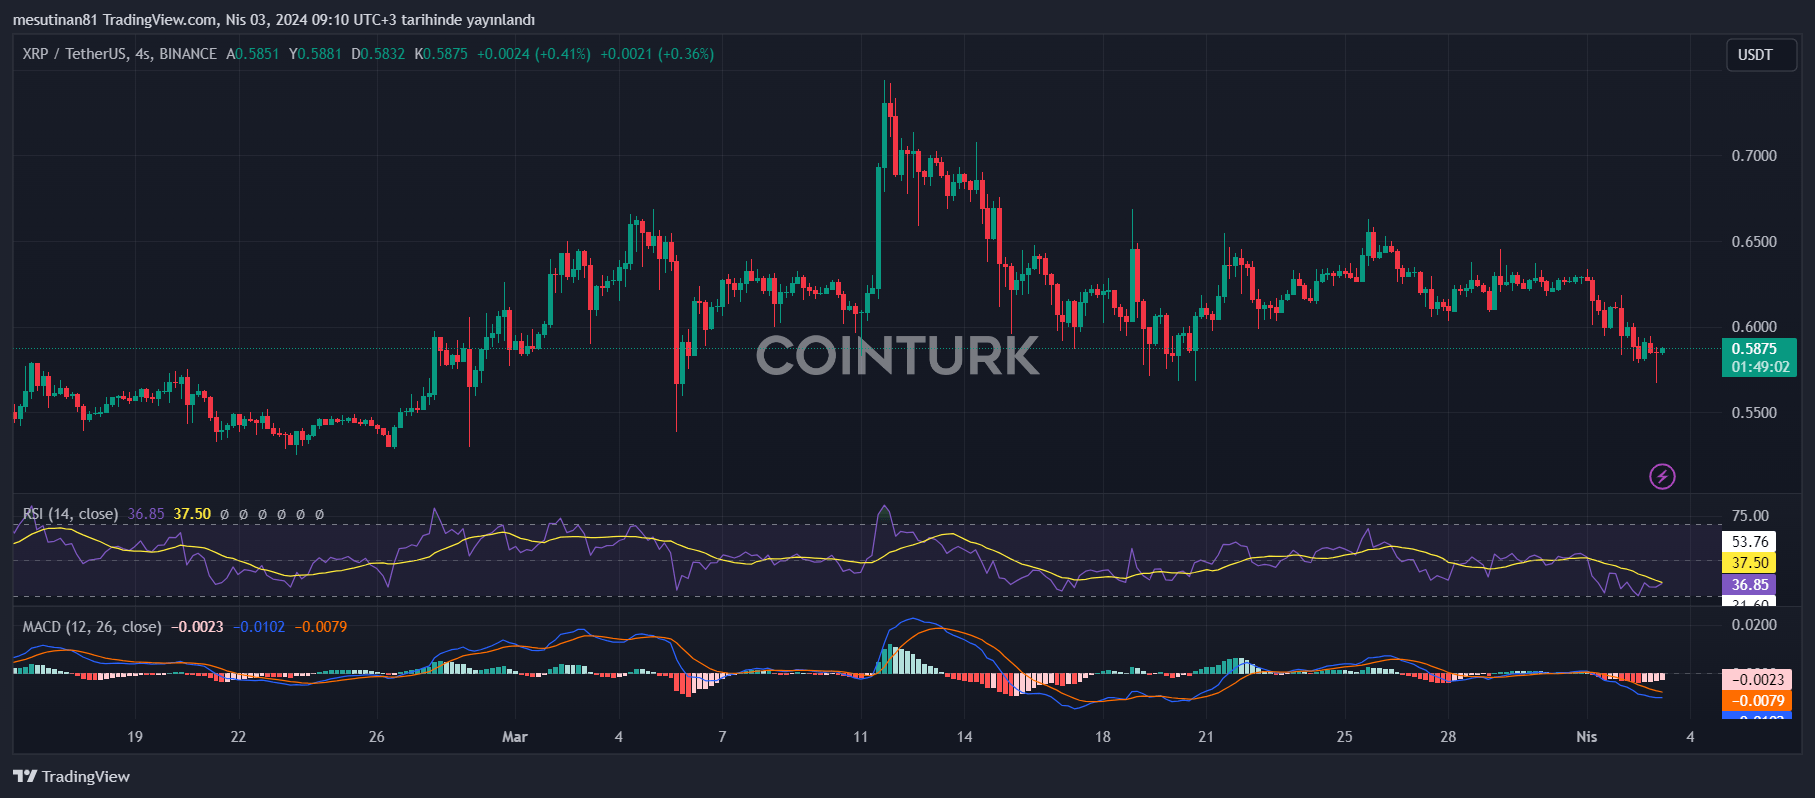
Cryptocurrency market leader Ripple (XRP) is currently struggling with harsh downward pressures on its price. Particularly, its persistence below $0.620 necessitates staying above the $0.5680 support level for any new attempt at a rise. However, XRP has recently been trading below the risky $0.6 support level, facing an increased risk of further decline.
XRP Exhibits a Downward Trend
Recent developments indicate that the XRP price has been following a downward trajectory from the $0.6620 resistance zone. Currently, the price is trading below $0.620 and the 100-day simple moving average. A downward trend line around $0.600 resistance is particularly noticeable on the 4-hour chart, which could accelerate the downtrend if there’s a close below the $0.5680 support.
The volatility in recent sessions has led to a significant drop in XRP from the $0.650 levels. The downtrend in major cryptocurrencies like Bitcoin and Ethereum has also contributed to XRP falling below the $0.620 and $0.605 support levels.
XRP Price Attempts to Recover
With the price retreating to the $0.580 level, a low point formed around $0.5805, and currently, the price is trying to consolidate its losses. However, factors such as resistance near the $0.600 region and the trend line highlight the difficulty of gaining upward momentum.
Technical analysis shows that the price remains below $0.620 and the 100-day simple moving average. Overcoming the resistance and trend line around $0.600 is critical, but a more robust increase might require a close above the $0.6250 resistance zone. In this case, the key resistance level around $0.6620 could be targeted.

If bulls manage to sustain movements above the $0.6620 resistance level, a rally towards the $0.680 resistance could be expected. However, for larger gains, the price needs to surpass the $0.700 resistance level.
Potential for Further Decline
Currently, XRP is struggling to overcome the $0.600 resistance zone. If this resistance cannot be breached, the asset might enter another downtrend. The first support on the downside is near the $0.580 levels, with the $0.5680 level emerging as the main support point in case of a more pronounced decline.
If a breakdown below this level occurs, the price could move further down, potentially retesting the $0.5250 support zone.
What Do Technical Indicators Suggest?
Upon examining technical indicators, the 4-hour MACD for the XRP/USD pair is showing a bearish trend. Additionally, the 4-hour RSI is trading below the 50 level, indicating that selling pressure may continue.
Key levels for altcoin XRP include support points at $0.580, $0.5680, and $0.5250. Resistance levels are identified at $0.600, $0.6250, and $0.6620, respectively.

 Türkçe
 Español


