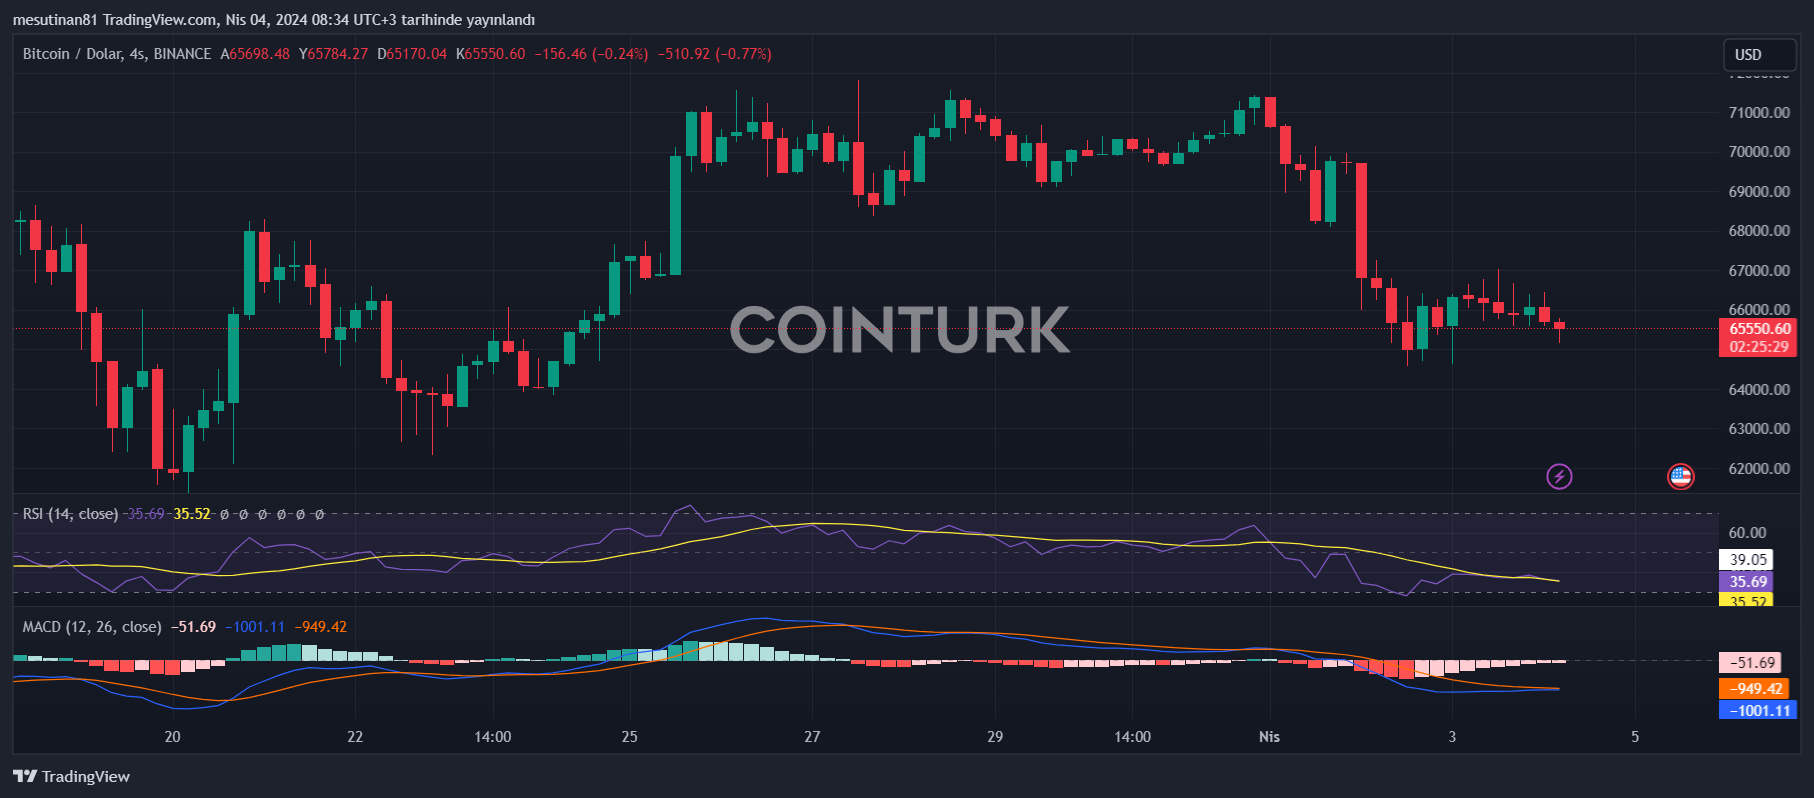
Bitcoin is currently attempting to surpass a significant resistance level of $66,000, which has been seen as a leading indicator of a potential rise in the crypto market. However, there are concerns that if BTC closes below the $64,500 level, it could gain downward momentum. So, what are the levels to watch for Bitcoin today?
Bitcoin Price Encounters Obstacles
The cryptocurrency Bitcoin is facing a series of obstacles near the $66,500 and $67,000 levels. Currently, the price is trading below the $67,000 level and the 100-hour simple moving average. On the hourly chart of the BTC/USD pair, there is a significant bearish trend line forming resistance around $66,400. This indicates that the pair is currently at risk of a downward break below the support region of $64,500.
After a decline towards the $64,500 level, Bitcoin’s price entered a consolidation phase. BTC dropped to as low as $64,572 and recently attempted a minor recovery wave.
Critical Resistance Levels for BTC
However, this recovery wave could not sustain above the $66,000 level. Bears are observed to be active near the $66,600 level. The immediate resistance level is $66,400, close to the trend line. The first major resistance level is identified at $66,600.
If there is a clear move above the $66,600 resistance area, the price could start a new upward trend. The next major resistance is near the $68,750 area. Further gains could send Bitcoin towards the $70,000 resistance area in the near term.
Bitcoin’s Downtrend Continues: Can It Maintain Support?
While the crypto market continues its volatile course, all eyes are on Bitcoin’s struggle to overcome the critical resistance level of $66,600. Failure to breach this barrier could mean further losses for the leading cryptocurrency.

Bitcoin is currently trading near the $65,200 level, where immediate support is expected. However, analysts warn that if this support is broken, BTC could face intense downward pressure.
The first significant support is at $64,600, followed by the $64,000 level. A break below $64,000 could pave the way for a drop to $62,500, and a potential downward risk towards the $60,500 support region could emerge on the horizon.
Technical Indicators Signal Weakening Bullish Momentum
From a technical standpoint, the 4-hour MACD is indicating a strengthening bearish trend, while the Relative Strength Index (RSI) for BTC/USD has fallen below the critical 50 level, suggesting a weakening of the bullish momentum.
For investors, it is imperative to closely monitor these support and resistance levels, with key support zones currently at $65,200 and $64,500. On the upside, Bitcoin faces significant hurdles at $66,600, followed by $67,000 and $67,950.

 Türkçe
 Español


