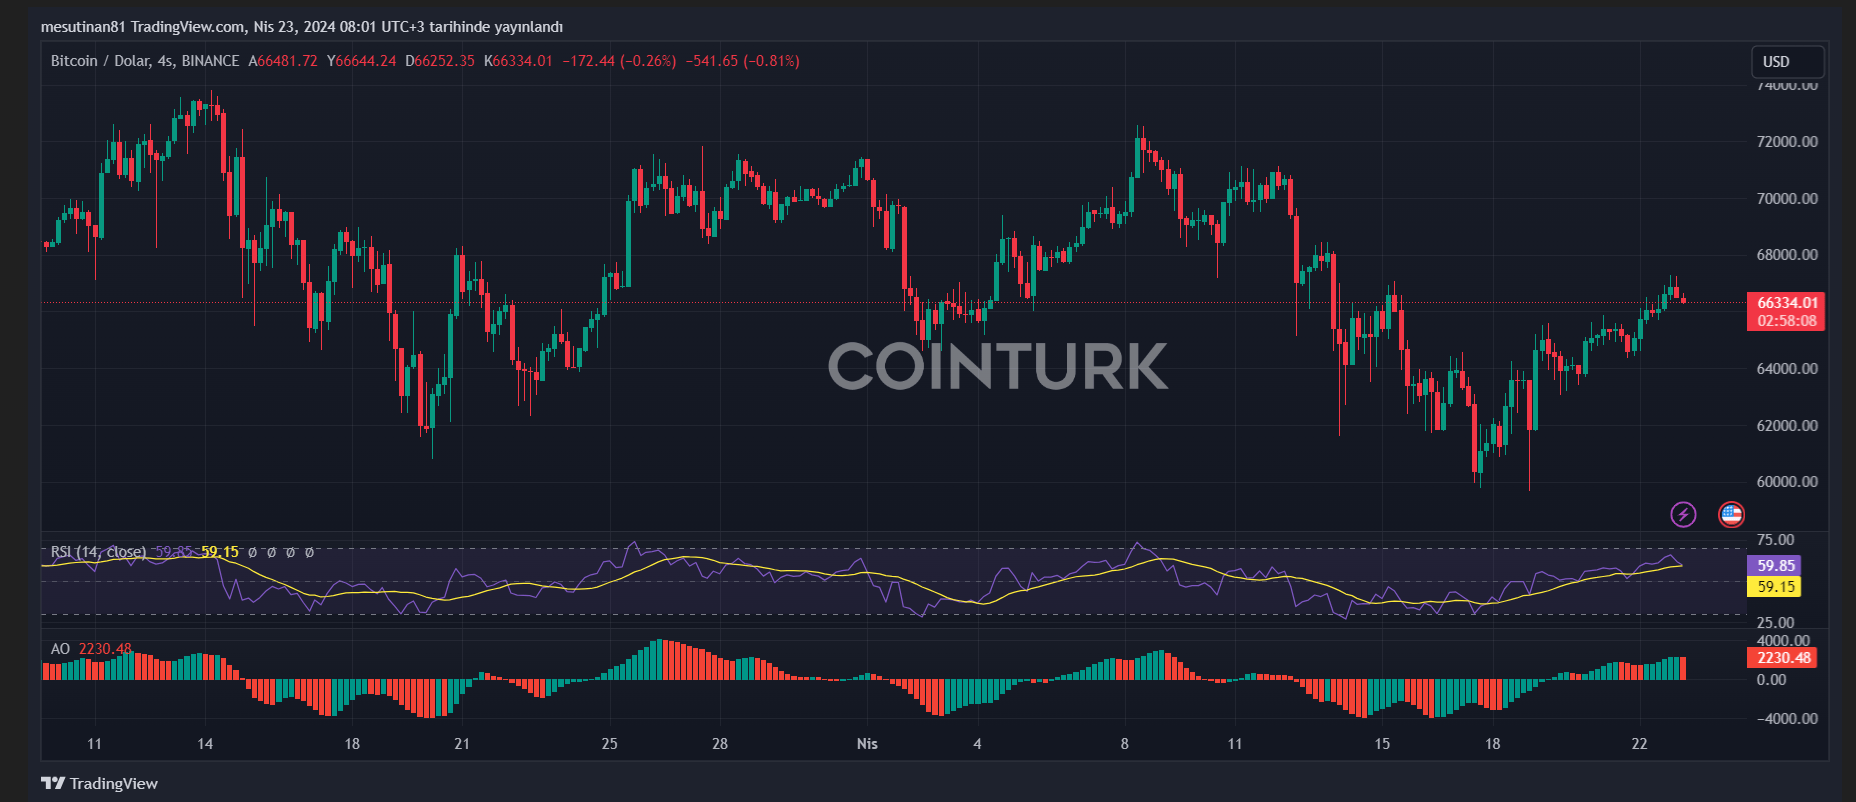
Bitcoin‘s rise does not seem to slow down. The cryptocurrency has gained positive momentum by breaking above the $67,000 resistance zone. It is currently trading around $66,300 and appears to be under the control of the bulls. Looking at the hourly chart of the BTC/USD pair, there is a clear upward trend line at the $65,700 level. This indicates that the price is moving towards a significant support point. Additionally, the 100-hour Simple Moving Average (SMA) is also holding above the $65,500 level, indicating that the bulls are actively strong.
Bitcoin Faces Critical Resistance at $67,500
Following the recent rise, Bitcoin might undergo some correction. However, this correction may not drop below the $65,500 level, as it emerges as a strong support.
Looking at short-term resistance levels, there is an immediate resistance near $67,000. However, the true resistance lies at the $67,500 level. If this level is breached, the next target could be $68,500. And if this resistance zone is also surpassed, it is likely that BTC will embark on a journey towards the $70,000 level.

Looking at long-term targets, the $70,500 level emerges as a critical resistance point for Bitcoin. If the bulls manage to surpass this level, a move towards the $72,000 level is expected.
Potential Levels to Watch if Bitcoin Undergoes Correction
Bitcoin, the most coveted asset in the cryptocurrency world, could experience a correction movement if it fails to surpass the $67,500 resistance zone. According to the technical analysis of the BTC/USD pair, an immediate support level is found around $66,500.
However, if a break below this level occurs, prices could move further downward. The first major support level is at $65,700. If prices close below $65,500, then a downward trend towards $65,000 could be indicated. Worse, this downward trend could direct prices towards the $64,200 support region in the near term.
Technical Indicators Suggest Slowdown in Rise
Looking at the technical indicators, the four-hour MACD currently shows that Bitcoin’s rise is slowing down in the bullish zone. Meanwhile, the four-hour RSI (Relative Strength Index) for BTC/USD is trending above the 50 level.
The main support levels are determined as $66,500 and then $65,500, while the main resistance levels are highlighted as $67,200, $67,500, and $68,500.


