Bitcoin halving has passed, and attention has turned to analysts’ comments. A popular trader known for many accurate predictions in the crypto market recently revealed his forecast for Bitcoin‘s price direction following the halving.
Analyst Reveals Bitcoin Price Target
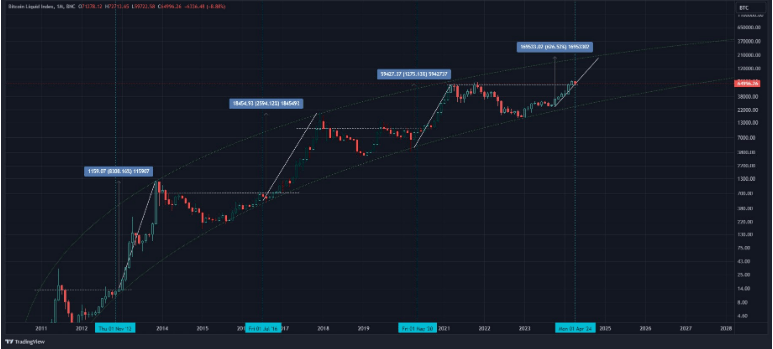
Dave the Wave, known to his thousands of followers on platform X, shared a chart indicating that Bitcoin could potentially reach $169,500 by the end of 2024.
According to Dave the Wave’s analysis, since the first halving in 2012, Bitcoin has hosted continually decreasing returns after each bull market.
In the process that started after the fourth halving, the trader indicated that he expects Bitcoin to rise by more than 626% from its bottom level. This marks a significant drop compared to the 1,275% gain seen in the 2020 cycle.
The only nearly constant thing is the decrease in returns.

As of this writing, Bitcoin is trading at $66,728 after a 1% increase in the last 24 hours, which also led to an increase in market volume. The volume has surpassed $1.3 trillion following the rise.
The 24-hour trading volume has decreased by 4.5%, falling to $25 billion. This situation, occurring alongside the price increase, suggests that investors are reluctant to sell and see their BTC as more valuable.
Bitcoin’s Future According to the Analyst
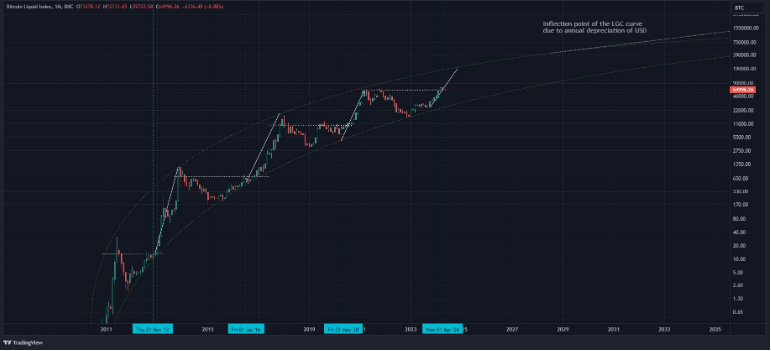
Dave the Wave ignored short-term volatility and used the logarithmic growth curve (LGC) to analyze Bitcoin’s future price outlook, aiming to find the highest and lowest levels of the current market cycle.
According to the analyst, it was not surprising for Bitcoin to reach an all-time high before the halving. Dave the Wave believes that the halving marks the midpoint of a bull market, and it is possible for BTC to move towards the peak indicated by the LGC model from this point.
Much is made about the current Bitcoin halving being at the highest price compared to previous ones.
However, when you see that each previous halving has pushed the prices to challenge all-time highs during the last month of the previous ‘cycle,’ it’s not that significant…
The takeaway from this series of charts is that all halvings roughly mark a recovery in prices and point towards a midpoint towards the peaks.
Also, even though a nominally higher price was seen at the second peak, the last peak should be considered the macro peak (in terms of momentum).


 Türkçe
 Español


