As in the past, between May 3 and 4, the market revival brought meme coins back to the stage. Leading the way, dogwifhat (WIF) unexpectedly surged by 20.58%. At the same time, Dogecoin (DOGE) rose by 13.80%, while Pepe (PEPE) gained 12.93% in value. This rally was joined by other assets like Floki (FLOKI), Bonk (BONK), and Shiba Inu (SHIB), which outpaced many other cryptocurrencies in the market.
WIF and DOGE
While writing this article, the price of WIF had reached $3.32, and there was no significant resistance seen in the last four-hour chart. This situation could challenge the bears if WIF maintains its upward momentum.
The golden ratio, known as the 1.618 level, marks the next potential support point for WIF at $4.36. Moreover, there seems to be a correlation between DOGE and WIF. If this correlation continues, DOGE could rise to $0.18, marking a 19.17% increase.

However, the Relative Strength Index (RSI) shows that both WIF and DOGE are in the overbought zone. This indicates that investors should be cautious. If profit-taking starts, there could be a pullback in the prices of these cryptocurrencies. Nevertheless, the upward scenario could bring further value increases.
PEPE and FLOKI
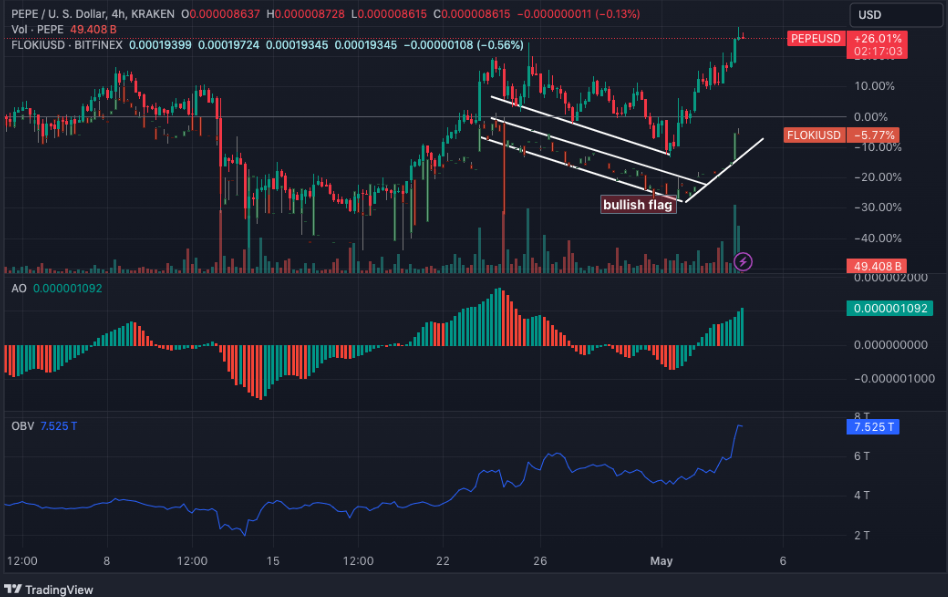
The market dynamics of PEPE were similar to those of WIF, and FLOKI also benefited from this trend. When examining the four-hour chart, the breakout experienced by PEPE and FLOKI appears to stem from a bull flag formation.
This breakout is due to the exhaustion of sellers’ power. Therefore, if PEPE’s price increases, FLOKI is likely to show a similar trend. However, if PEPE’s price falls, FLOKI could also decline. Additionally, the Awesome Oscillator (AO) indicated an increasing upward momentum.

Therefore, PEPE’s price could continue a similar upward trend with FLOKI’s price. Moreover, the OBV metric also showed an increase, indicating strong buying pressure keeping the price up.
BONK and SHIB
An analysis of BONK and SHIB charts shows some differences. Sometimes their prices move together, and other times they diverge. Notably, the Money Flow Index (MFI) on the BONK/USD four-hour chart indicates that the BONK token has entered the overbought zone.

This situation arises as the MFI reading reaches 89.99. A reading above 80.00 indicates that an asset is overbought. At the same time, a high MFI reading, indicating intense capital inflow, suggests that traders may soon start taking profits, which could lead to a drop in SHIB and BONK prices.

 Türkçe
 Español


