In the cryptocurrency market, Bitcoin’s loss in value has created selling pressure for many altcoins. However, during this period, projects with their own narratives continue to stand out. The recent days have continued to highlight the rises and falls focused on these narratives. What can be said about XRP, APT, SOL, and RNDR in this process? We are examining them with detailed chart analyses and important levels.
XRP Chart Analysis
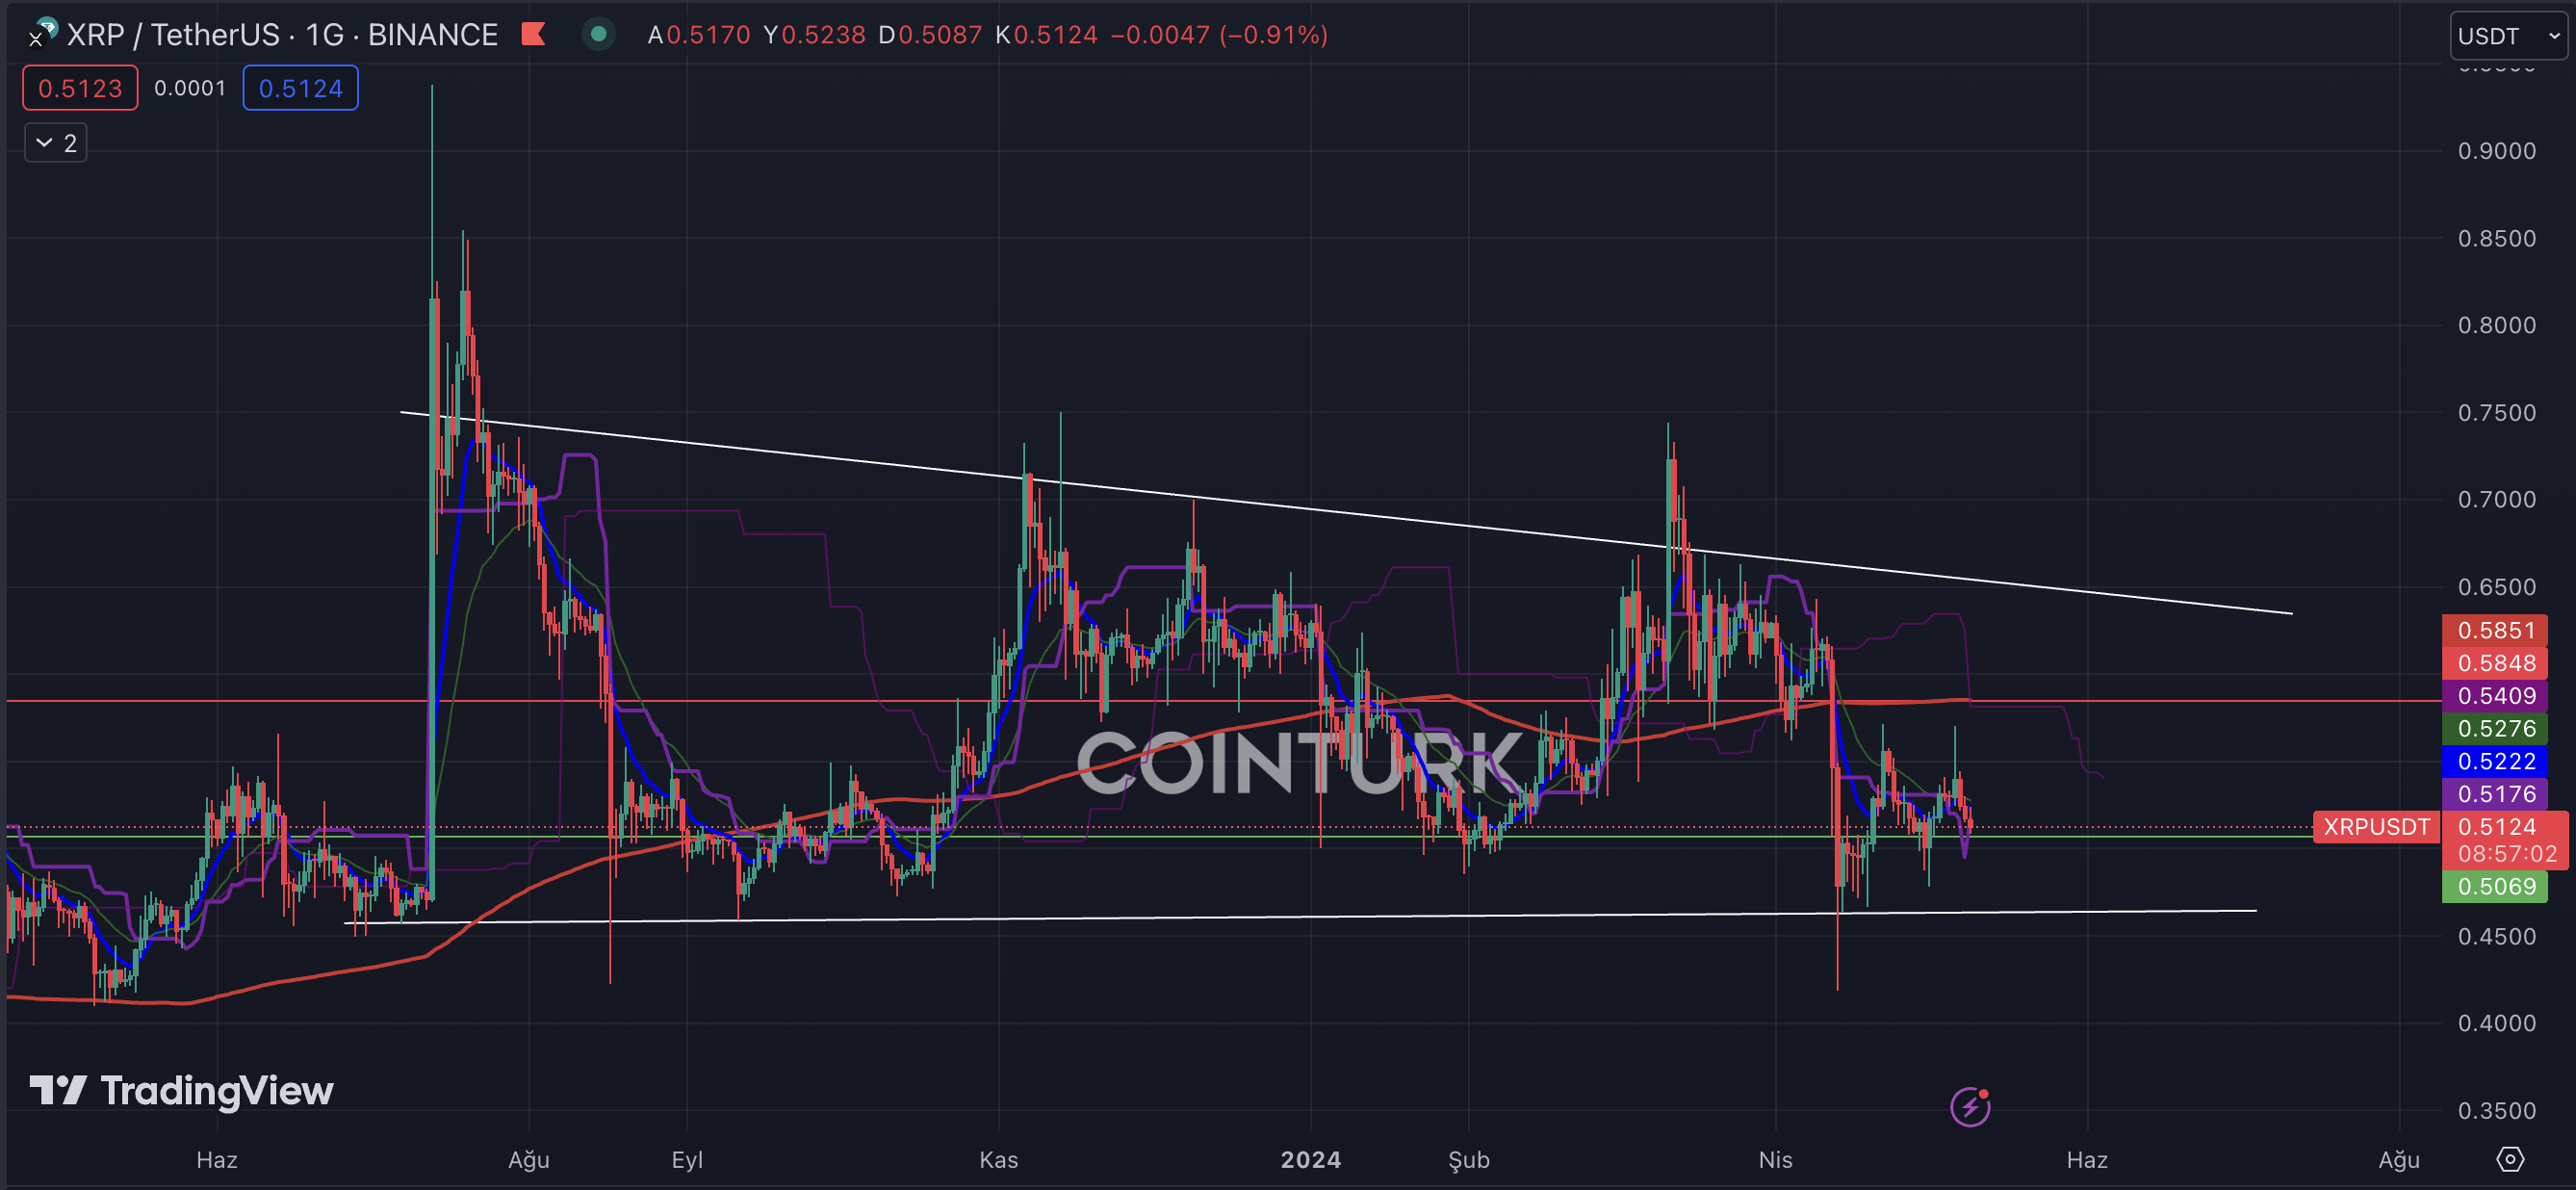
The daily XRP chart has been dominated by a narrowing wedge formation for almost a year. XRP has managed to please its investors somewhat with news-driven rises, especially after the recent support touch, where it is struggling to gather strength.
The most important support level to watch on the daily XRP chart is $0.5069. A bar close below this level could lead to a price drop to $0.45. The most critical resistance level for XRP is the EMA 200 (red line) average at $0.5851.

APT Chart Analysis
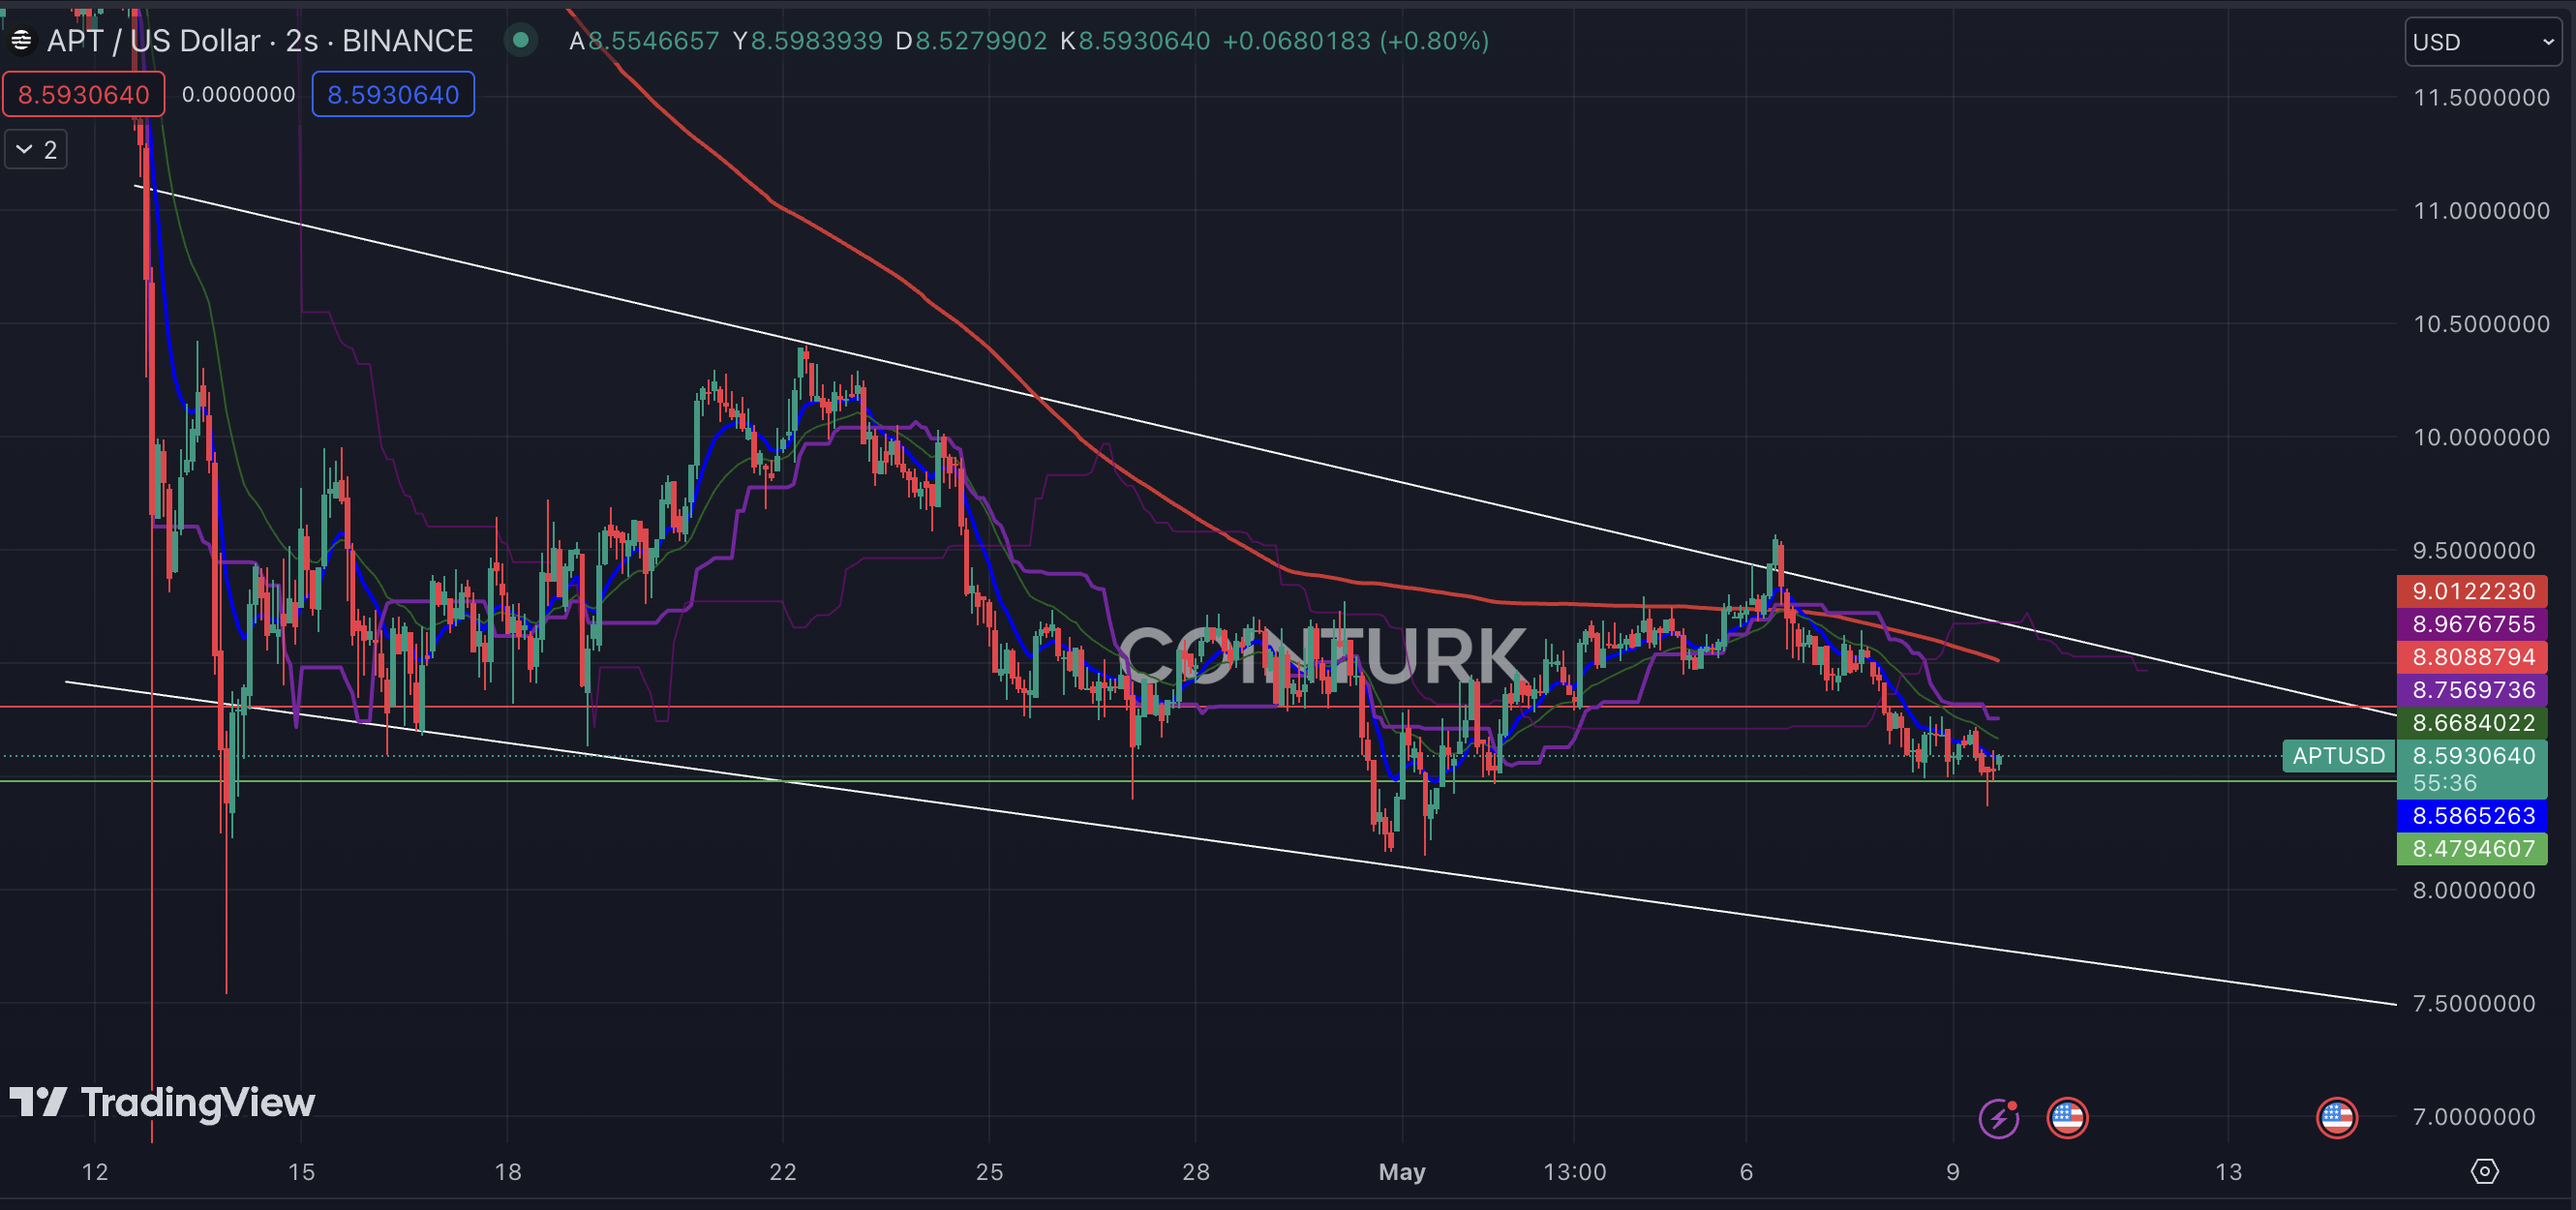
APT is drawing attention with a $97 million token unlock event scheduled for May 12th. In the two-hour chart, a falling channel formation continues to be a topic of discussion. Recently touching the resistance level, APT may face short-term downward pressure.
The most important support level to monitor on the two-hour APT chart is $8.47. A daily close below this level could create downward pressure for APT. The key resistance level to watch is $8.80, where a bar close above this level could accelerate APT’s price momentum.

SOL Chart Analysis
Following network congestion issues within the Solana ecosystem, SOL’s price has managed to gain upward momentum. The rising trend line on the daily chart continues to provide significant clues for investors. The last bar formation where the EMA 9 (blue line) acted as support is noteworthy.
The most important support level to follow on the daily SOL chart is $133. A bar close below this level could cause SOL’s price to lose momentum. The critical resistance level for SOL is $146.

RNDR Chart Analysis
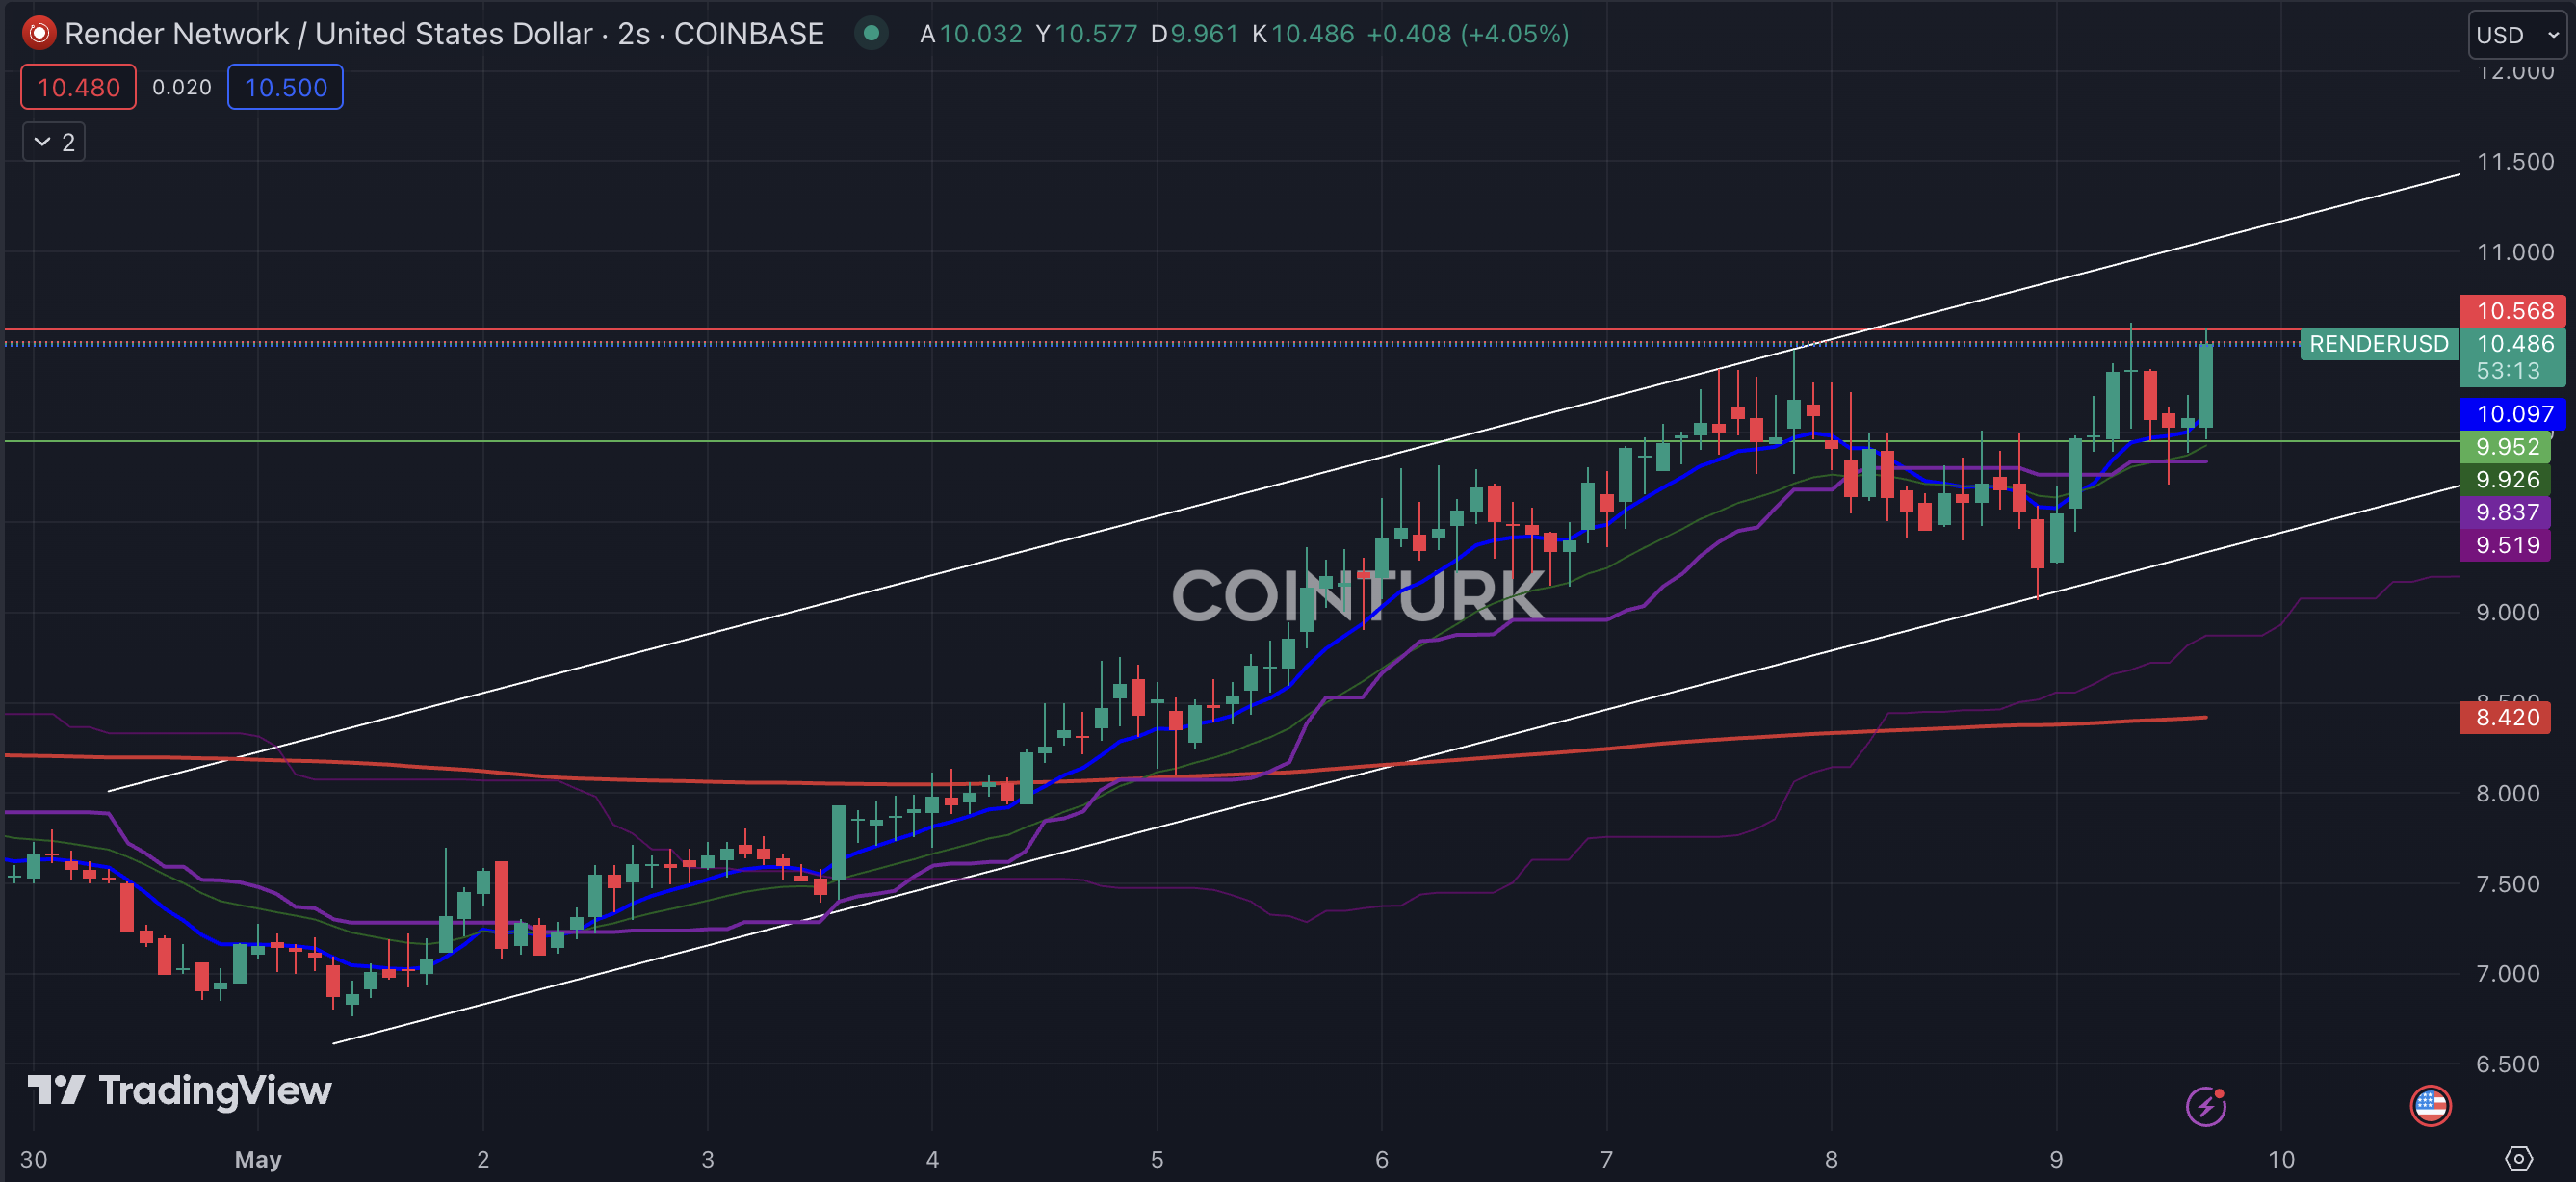
Recently, Render, an AI-focused altcoin project, has been among the top risers over the past week, featuring a notable rising channel formation on the two-hour chart. During this period, RNDR has pleased many of its investors, particularly as the EMA 9 level has taken on a supportive role.

The most important support level to monitor on the two-hour RNDR chart is $10.097. A two-hour bar close below this level could cause RNDR’s price to lose momentum. The key resistance level to watch is $10.56.

 Türkçe
 Español


