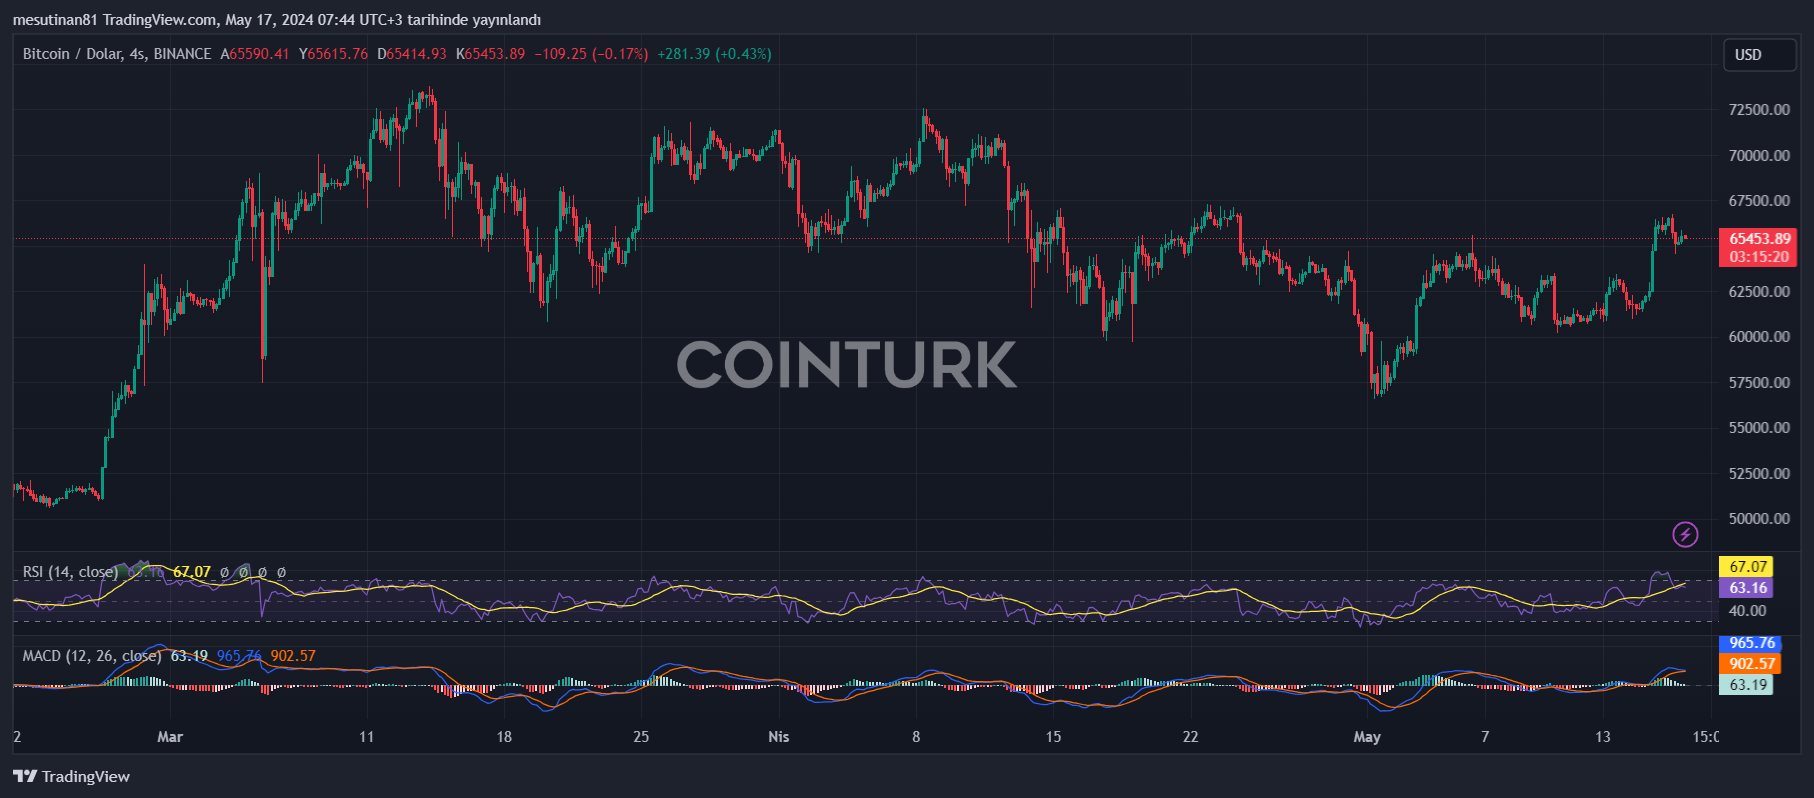
Bitcoin, recently exhibited a remarkable performance and its price surged rapidly. According to the latest data, Bitcoin tested the critical resistance level of $66,500 and is currently consolidating its gains. In the coming period, another increase towards the $67,500 level may be attempted. So, which levels are important to watch for the price?
Bitcoin Must Surpass $66,000
Bitcoin seems to have entered a consolidation phase from the $66,500 resistance area. The price is currently trading above the $65,000 level. The BTC/USD pair’s hourly chart shows a significant uptrend line at the $65,150 level.
However, unless the bears push the price below $63,800, Bitcoin is likely to start a new increase. In this case, Bitcoin’s price may continue to be supported and a new rise above the $63,500 level may be observed.
Bitcoin’s price recently showed a notable performance, surpassing the $65,500 resistance and testing the $66,500 area. This means a new weekly high of $66,565.
In the coming period, the first major resistance level for Bitcoin could be $66,000. A clear move above this level could push the price further up and cause it to test the next key resistance level of $66,500. If the bulls remain active, the price could rise towards the $68,000 resistance area. Further gains could send Bitcoin towards the $70,000 barrier.
What Levels to Watch If a Decline Occurs?
If BTC fails to surpass the significant resistance area of $66,000, it may show more bearish tendencies. At this point, technical indicators and critical support levels are closely monitored. Currently, the BTC/USD pair failed to break above the $66,000 resistance area on the hourly chart and is showing downward momentum. In this case, it is crucial for the price to hold near the immediate support level of $65,150 and the trend line in the short term.

If further declines occur, the first major support level is determined to be $64,200. Beyond that, the main support is around $63,800. A break below this level could direct the price towards the $63,150 support area in the near term.
When examining technical indicators, the four-hour MACD is seen to have lost its upward momentum and is showing a downward trend. However, the four-hour RSI is currently above the 50 level. This partly indicates that buying pressure continues.


