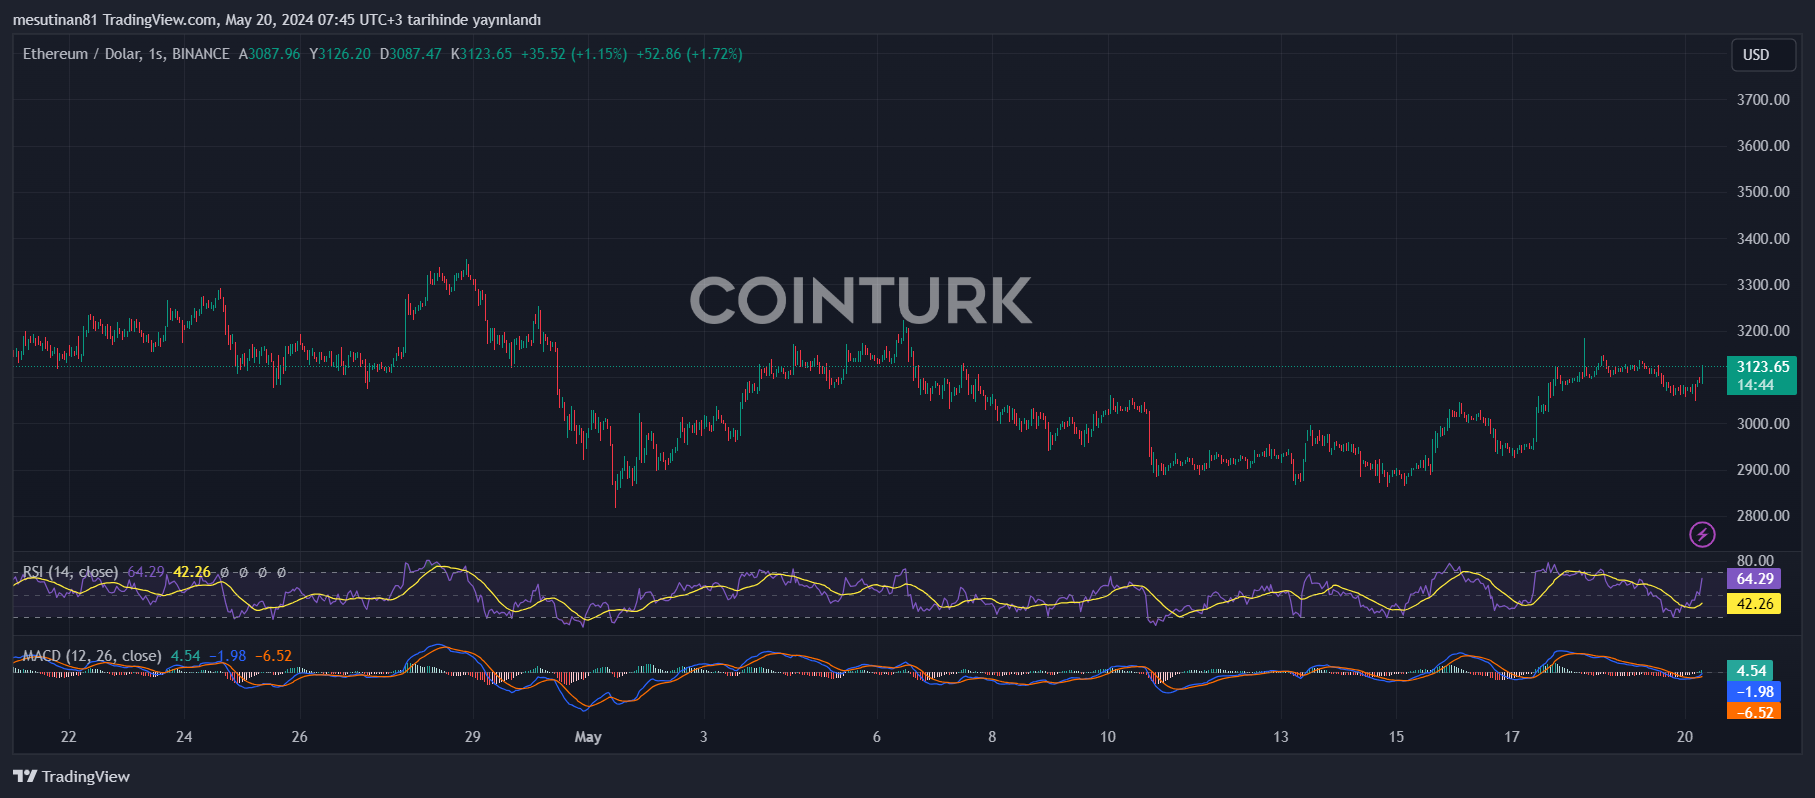
Cryptocurrency market activity continues. The leader of altcoins, Ethereum (ETH), recently initiated a downward correction from the $3,150 resistance level. However, despite this correction, ETH maintains its strong stance and appears to have the potential to rise again.
Ethereum Managed to Stay Above $3,000
Ethereum managed to stay above the $3,000 level throughout the past week, indicating that the bulls are in control. Especially trading above the $3,050 level suggests that ETH is in a healthy correction process. The new weekly peak of $3,144 saw a brief decline as the bears intervened around $3,150.
It is worth noting that Ethereum is currently trading near the $3,120 level. The immediate resistance for ETH is at the $3,080 level. There is also a connecting downtrend line at $3,080 on the hourly chart of ETH/USD. A sustained move above this line could pave the way for the price to retest the $3,150 level.
$3,200 Could Be Surpassed
Especially surpassing the $3,150 level could allow ETH price to gain new upward momentum. Breaking above this resistance level could contribute to pushing the price to higher levels. The bulls remaining strong at this critical level could create a positive atmosphere in the market.
The next key resistance is at the $3,200 level, and above this, the price could gain interest and rise towards the $3,250 level. If there is a clear move above the $3,250 level, the price could rise and test the $3,320 resistance.
Pay Attention to These Levels for Ethereum!
Firstly, the initial support level for Ethereum is around $3,065. This level could limit the decline in the short term. However, if this support level is broken, the next major support area investors should watch is $3,000. If this critical level is breached, the price risks falling to $2,980. If it fails to hold at this point, Ethereum could retreat to levels around $2,860.

Technical indicators help us better understand the current state of the cryptocurrency Ethereum. The MACD (Moving Average Convergence Divergence) metric on the hourly chart is losing momentum in the bullish zone. This indicates that the upward movement is weakening and selling pressure is increasing. The MACD’s situation shows that investors are uncertain and hesitant about the sustainability of current price levels.
Additionally, the hourly RSI (Relative Strength Index) is currently below the 50 level. RSI typically signals oversold conditions below 30 and overbought conditions above 70. An RSI value below 50 indicates that the market is generally under selling pressure and the price is trending downward. This causes concern among investors.

 Türkçe
 Español


