Bitcoin surge has boosted many altcoin projects, delighting investors. Especially in memecoin projects, the rise has highlighted many ecosystems and supported the increase in blockchain network activities and local tokens. During this period, Solana and Arweave have drawn attention, so what do the graphic analyses say? We examine it with detailed graphic analysis and important levels.
Solana Graphic Analysis
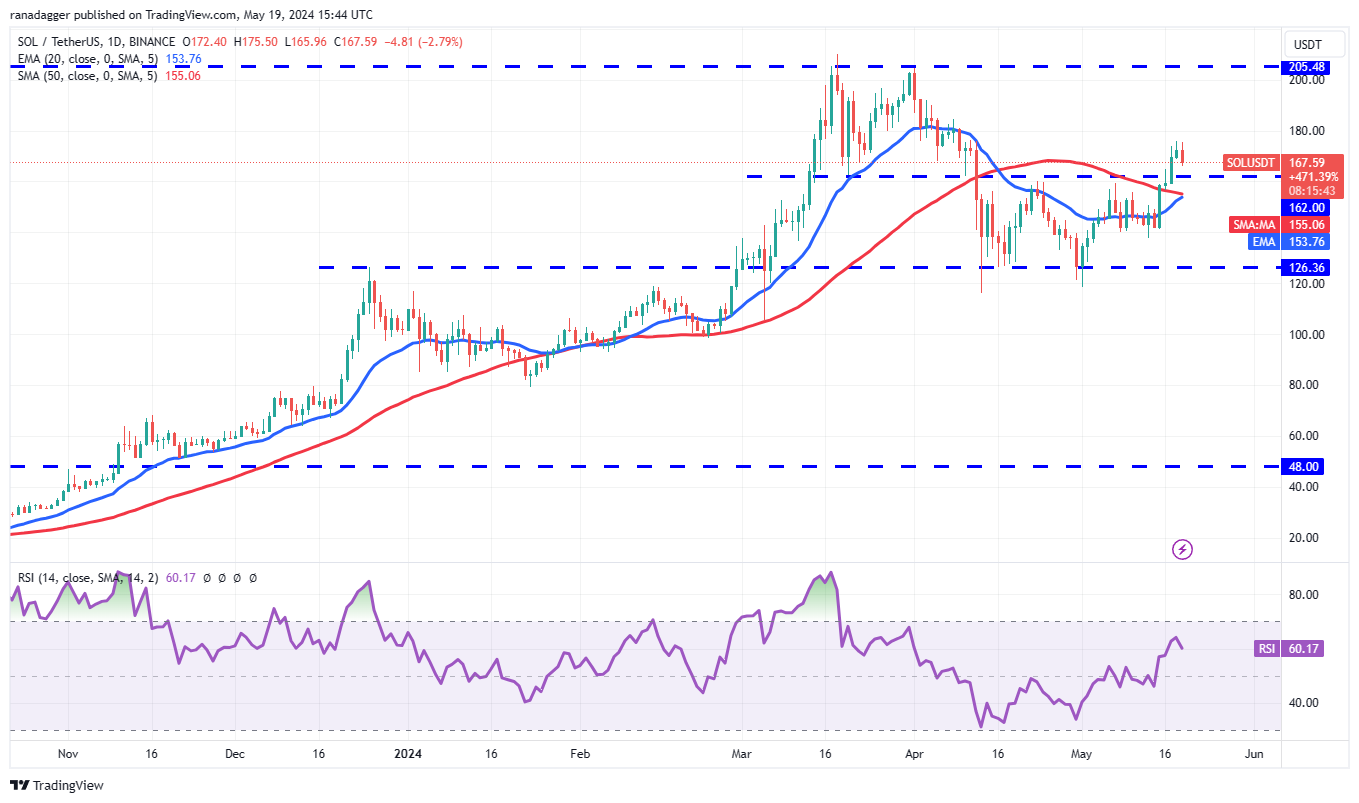
On May 15, Solana rose above the moving averages, and the bulls are trying to strengthen their position. There is resistance at $176, where the bears will try to initiate a correction. The key level to watch on the downside is the $162 support level. If the price strongly rebounds from this level, it will indicate that the bulls are trying to turn $162 into support and increase the likelihood of breaking above $176. The SOL/USDT pair could then move to $185.

If the price declines and falls below the moving averages, this positive outlook will lose validity in the short term. This could lead to a prolonged liquidation, pulling the pair down to the $140 level.

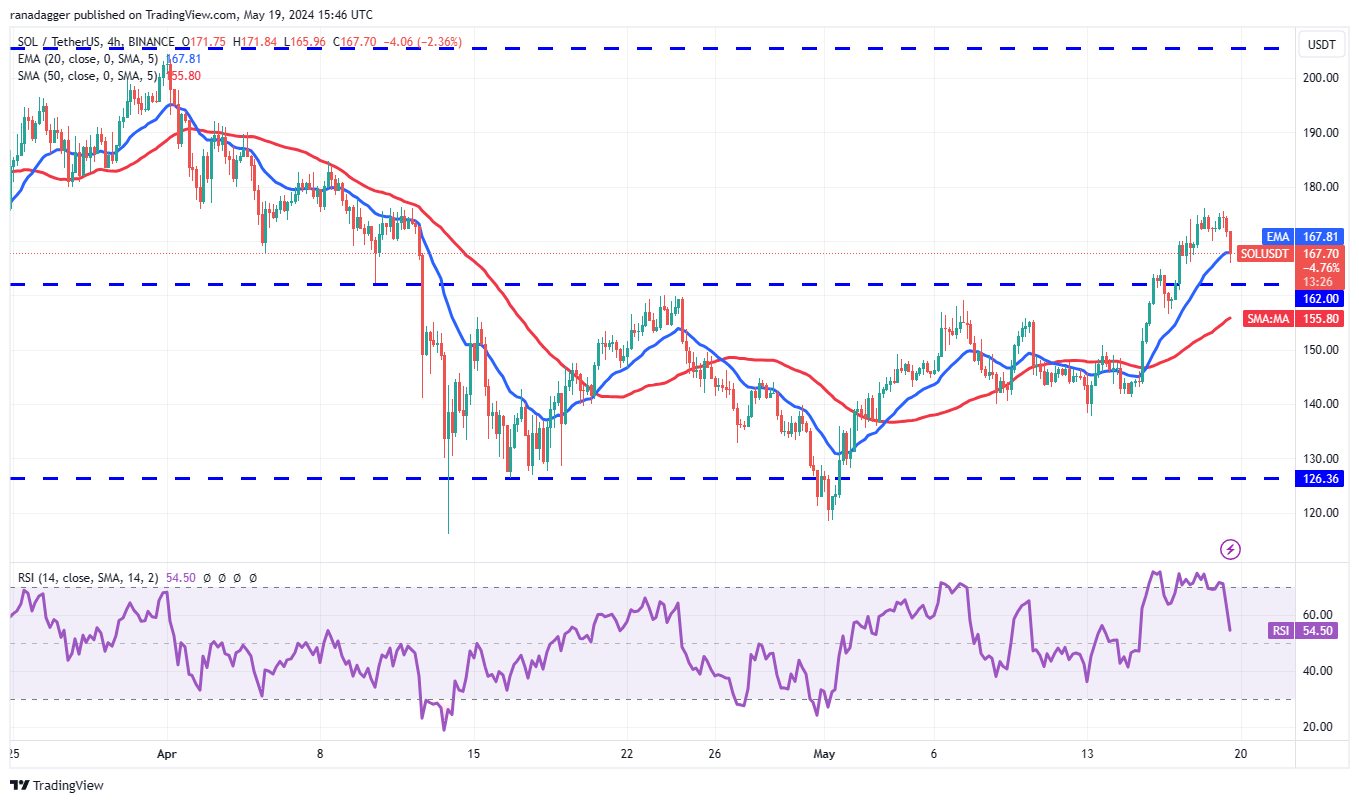
The pair retreated from the general resistance around $176 and fell below the 20-day EMA. It is likely to retest the $162 breakout level, where buyers are expected to step in and stop the decline. For the buyers to continue the uptrend, they need to push the price above $176.
If the pair falls below $162, it may indicate that the bulls have lost control. There is minor support at the 50-day SMA, but if this fails, the pair could drop to $140.
Arweave Graphic Analysis
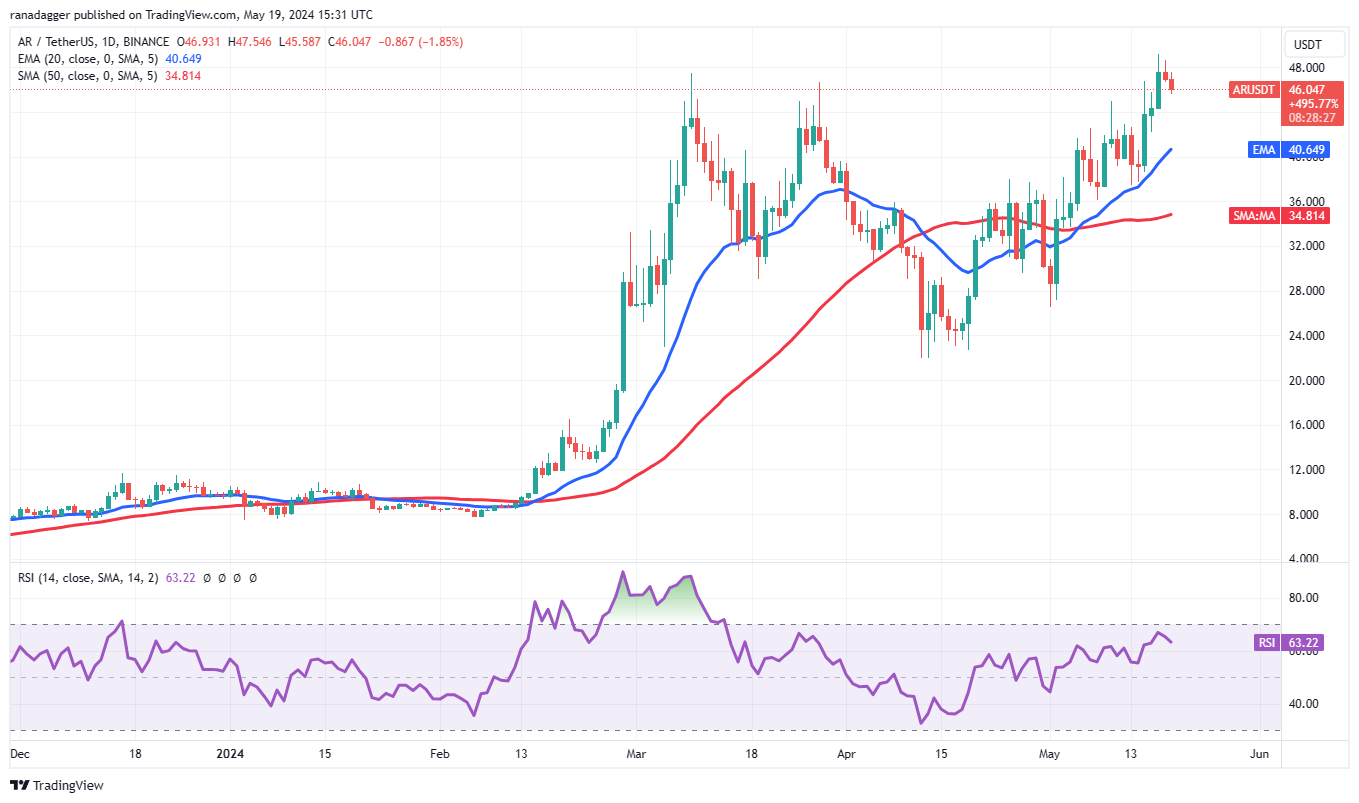
Arweave (AR) has been in an uptrend for the past few days. The bulls pushed the price above the general resistance of $47.51 on May 17 but failed to sustain higher levels. The bears are trying to pull the price down to the 20-day EMA at $40, an important level to watch.
A strong rebound from this level will indicate that the bulls are buying on dips. This process will increase the likelihood of a breakout above the psychological resistance of $50. In such a case, the AR/USDT pair could rise to $68.

Contrary to this assumption, if the price drops sharply and falls below the 20-day EMA, it will give the impression that the bulls are rushing for the exit. This could trigger a correction to the 50-day SMA at $35.

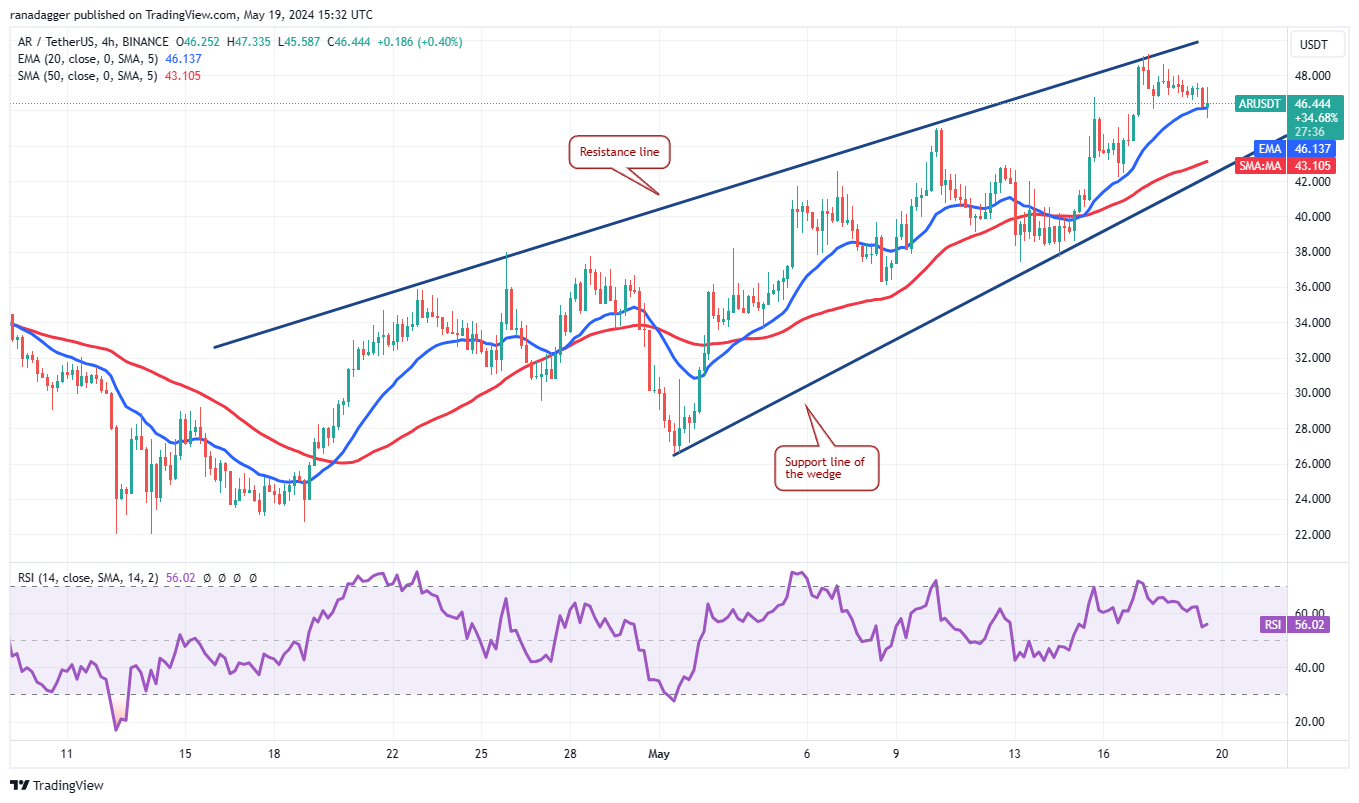
The 4-hour chart shows the formation of a rising wedge pattern. The 20-day EMA is an immediate support to watch on the downside. If this level breaks, the pair could slide towards the wedge’s support line. A break and close below the wedge could start a downward move to $38 and then $36.
Alternatively, if the price rises from the 20-day EMA or the support line and breaks above the wedge’s resistance line, it could signal that the bulls are in control. This will invalidate the bearish setup and start a move towards $68.

 Türkçe
 Español


