Bitcoin experienced a rise last week but continues to trade within a broad range. Did Bitcoin reach its peak, or will the rally continue? This question is on every investor’s mind. TLDR analyst “ELI5” shared an X post. On-chain data indicators suggest that five out of seven signals indicate a new bull market, while two point to a peak formation.
Bitcoin Price Outlook
Bitcoin’s recent bounce from the psychological support level of $60,000 may have triggered buying interest in spot Bitcoin exchange-traded funds. Data from Farside Investors shows an inflow of approximately $950 million last week, marking the best weekly performance since March. If inflows continue, Bitcoin could sustain upward price movements.
10x Research’s research director Markus Thielen suggested a potential rise in Bitcoin. A report by Thielen indicated that if Bitcoin’s ETF model moves above $67,500, it could reach new highs, which seems to be materializing now.
S&P 500 Index Outlook
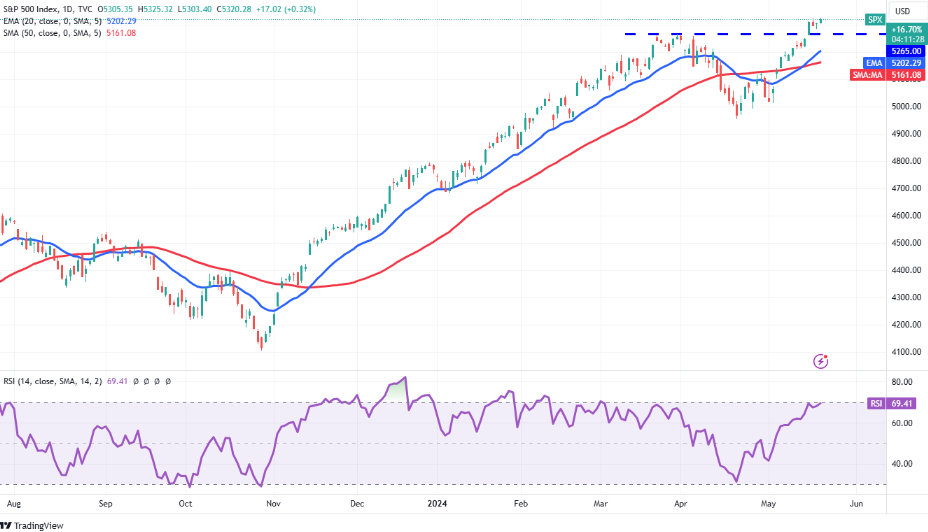
Alongside Bitcoin, the S&P 500 Index (SPX) reached an all-time high on May 15, demonstrating that bulls are in control of the market.
However, bears might still have some strength left. Bears could consider the 5,265 level as a critical point to pull the price below the breakout level. If bears succeed, the upward momentum might weaken, and the index could fall to the 20-day exponential moving average (5,202).

If the price strongly rebounds from the moving averages, it could indicate a continuation of the upward trend. The index might attempt to move towards 5,500.
Current Bitcoin Price
Bitcoin has been trading in a narrow range near $68,000 for the past three days and recently rose following news about the spot Ethereum ETF.
The rising 20-day EMA ($64,371) and the RSI in the positive zone indicate an upward path of least resistance. If the price sustainably surpasses $70,000, BTC/USDT could move towards $73,777. However, strong selling by bears in this region should not be overlooked.
The levels of moving averages are also crucial. These levels serve as key support points for investors in a downward trend. A break and close below the moving averages could signal that bulls have given up. In such a case, BTC’s price could first drop to $59,600 and then to $56,552.

 Türkçe
 Español


