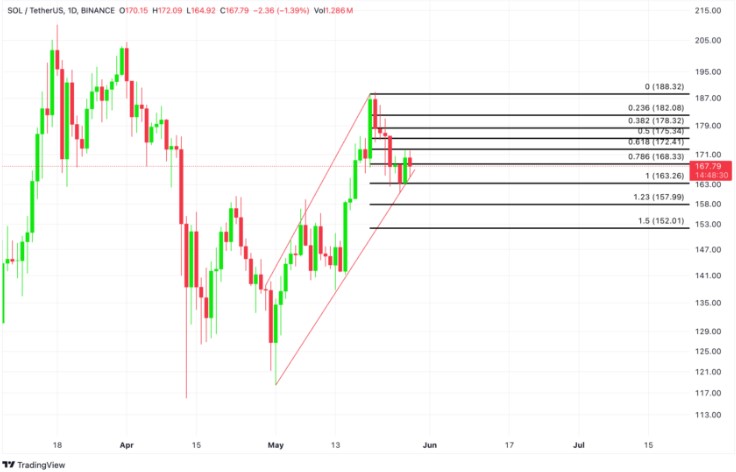
Solana (SOL) has been trading at the lower line of its rising channel since the beginning of the month. The drop towards the support line began on May 20. SOL’s movement within the rising channel has continued since it started its upward trend on April 30. On that date, the altcoin was trading at $129. As of May 20, its value rose to $184, and then selling activities began.
Expectations of Decline in SOL
The cryptocurrency’s price is now preparing to fall below the 20-day exponential moving average as it dropped last week. This moving average reflects SOL’s average price over the last 20 days. When a token’s price falls below this fundamental moving average, it can signal that the short-term trend may be shifting from bullish to bearish.
The reason for this is that the 20-day EMA acts as a support line, and breaking it can indicate that sellers are outpacing buyers. SOL’s moving average convergence divergence (MACD) data, which confirms the market trend shift from bullish to bearish, may show the MACD line intersecting with the signal line in a downward trend. This situation can indicate a momentum shift towards a bearish trend. Market participants often see this as a sign to exit long positions and take short positions.

Futures Trading in Solana
Since May 20, SOL has witnessed a decline in open positions in the futures market. At the time of writing, this figure stands at $2.44 billion, a 4% decrease over the past seven days. SOL futures open positions track the total number of open or unclosed futures contracts or positions. Such a decline may indicate that market participants are increasingly exiting trading positions without opening new ones.
According to experts, if the popular altcoin SOL’s price breaches the $163 support, it could fall further to $157.99. However, due to the positive funding rate on cryptocurrency exchanges, futures investors are still taking long positions in SOL. This situation could lead to an increase in buying pressure, pushing the asset’s price towards $172.41.

 Türkçe
 Español


