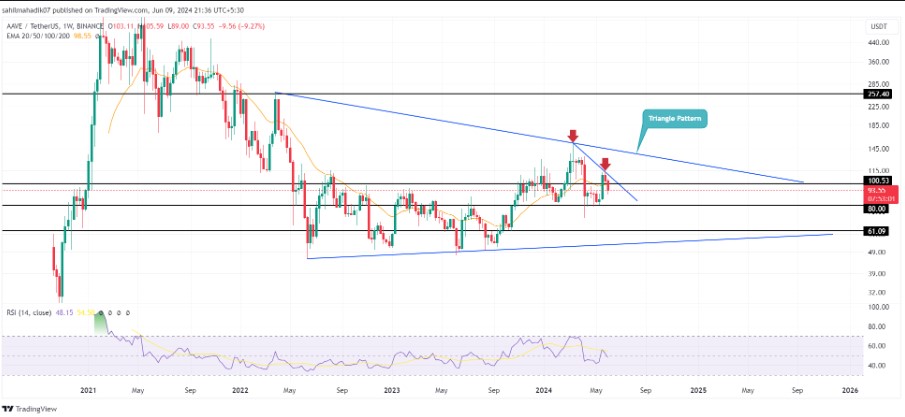
The cryptocurrency market witnessed renewed supply pressure this week as the price of Bitcoin (BTC) fell below the $70,000 level. The overall supply indicated extended consolidation for many top-tier tokens, including AAVE, as it lost the psychological level of $100.
Volume Increases in Aave
Additionally, the volume of high-risk loans under the Aave Protocol reaching new levels creates a liquidation risk for buyers if the market turns bearish. AAVE’s short-term trend shows a bearish pattern in the lower-high formation on the daily chart. These high movements, connected by a descending trend line, create significant resistance, strengthening the sentiment of selling during rebounds among investors.
Moreover, the Bitcoin price fluctuated with low volatility over the past two weeks, causing a sideways movement for many altcoins. However, AAVE suffered significant losses from this consolidation. It dropped 18.5% from $114.7 to $91.5, and its market value fell to $1.39 billion.
While the decentralized finance (DeFi) sector experienced unprecedented growth, concerns about the increasing volume of high-risk loans are rising. According to a recent analysis by the leading cryptocurrency analytics company IntoTheBlock, the total volume of high-risk loans in the DeFi lending platform Aave reached a concerning $1 billion.

Analytical Report on Aave
Data provided by IntoTheBlock highlights a sharp increase in these risky assets secured against volatile collateral, which are currently dangerously close to the liquidation threshold. Since the loans are within only 5% of triggering liquidation events that could affect the broader market, this situation poses significant risks.
If the correction trend continues, the AAVE price could witness heavy liquidation and drop to $80. The decline could also trigger panic selling among investors, causing the token to fall to $61. Analysis of the weekly chart shows that the long-term trend of the AAVE price resonates side by side within two converging trend lines. The sideways movement indicates the formation of a symmetrical triangle pattern. Additionally, the leading consolidation trend on the chart consists of momentum for direction.

 Türkçe
 Español


