Historical data can sometimes be misleading, but Bitcoin has achieved significant success in its short history. Bitcoin (BTC) price is at $65,078 at the time of writing, and altcoins have turned red again. BTC has lost an important support level, so we can look at five major indicators to determine our current stage.
Is It Time to Buy Cryptocurrency?
Lookonchain recently reminded cryptocurrency investors of five indicators they should pay attention to. These indicators tell us what stage we are at and whether it’s time to sell and escape. Let’s briefly look at them.
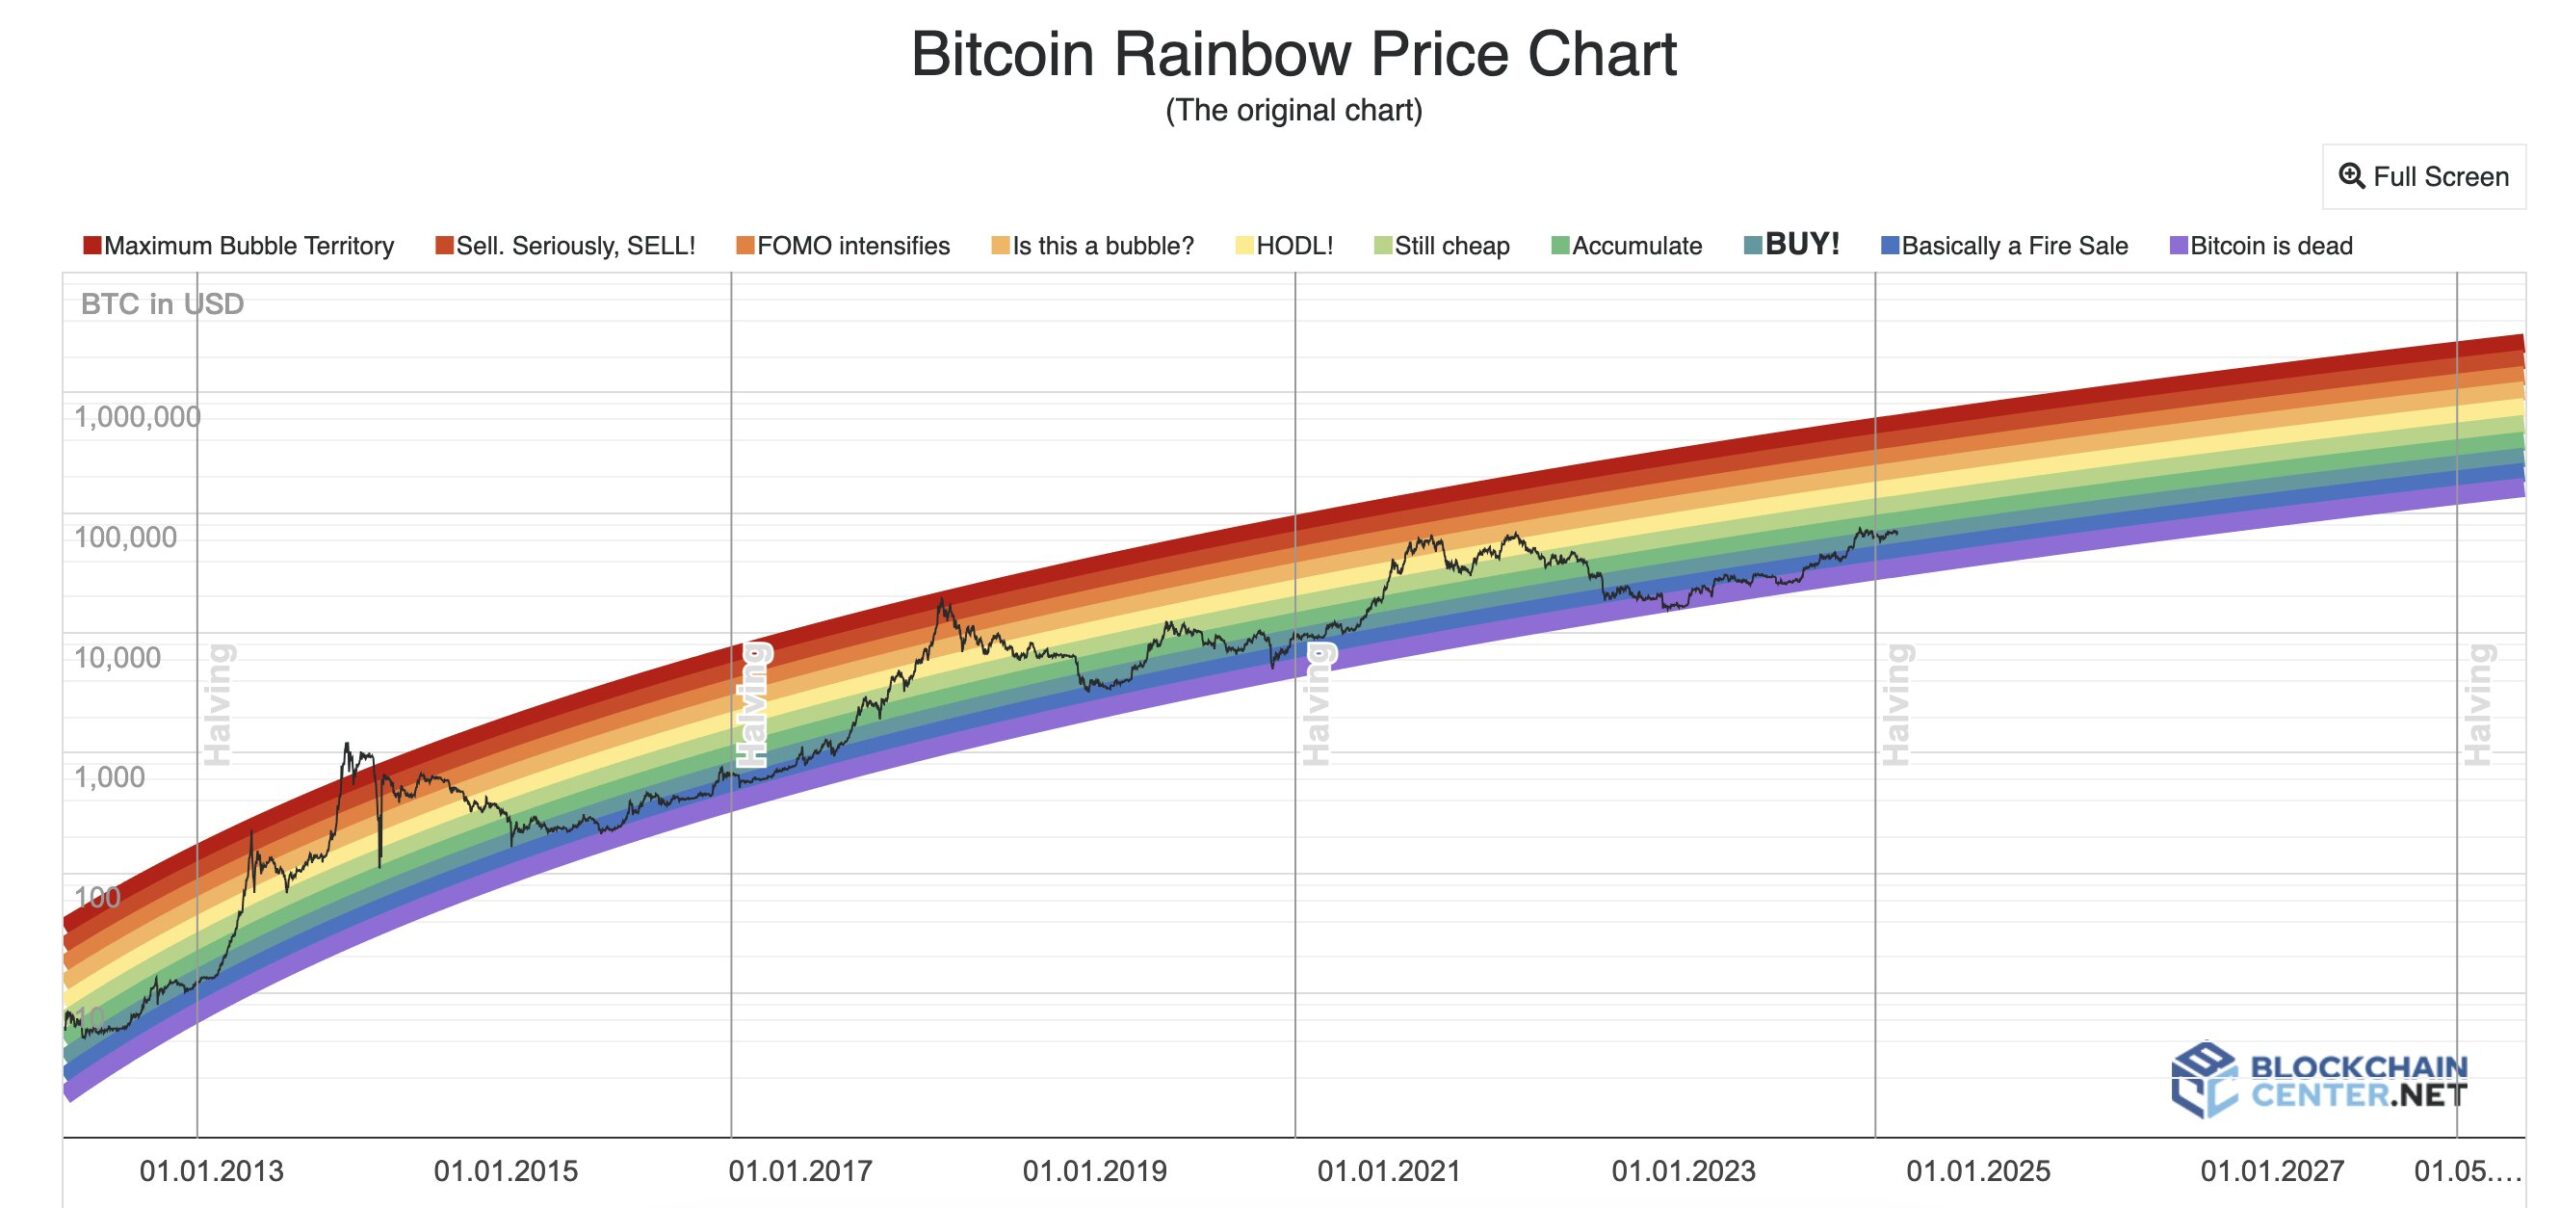
Rainbow Chart
The Rainbow Chart is a long-term valuation tool that uses a logarithmic growth curve to predict BTC’s potential future price direction. The Rainbow Chart currently shows that it is still a good time to buy BTC.

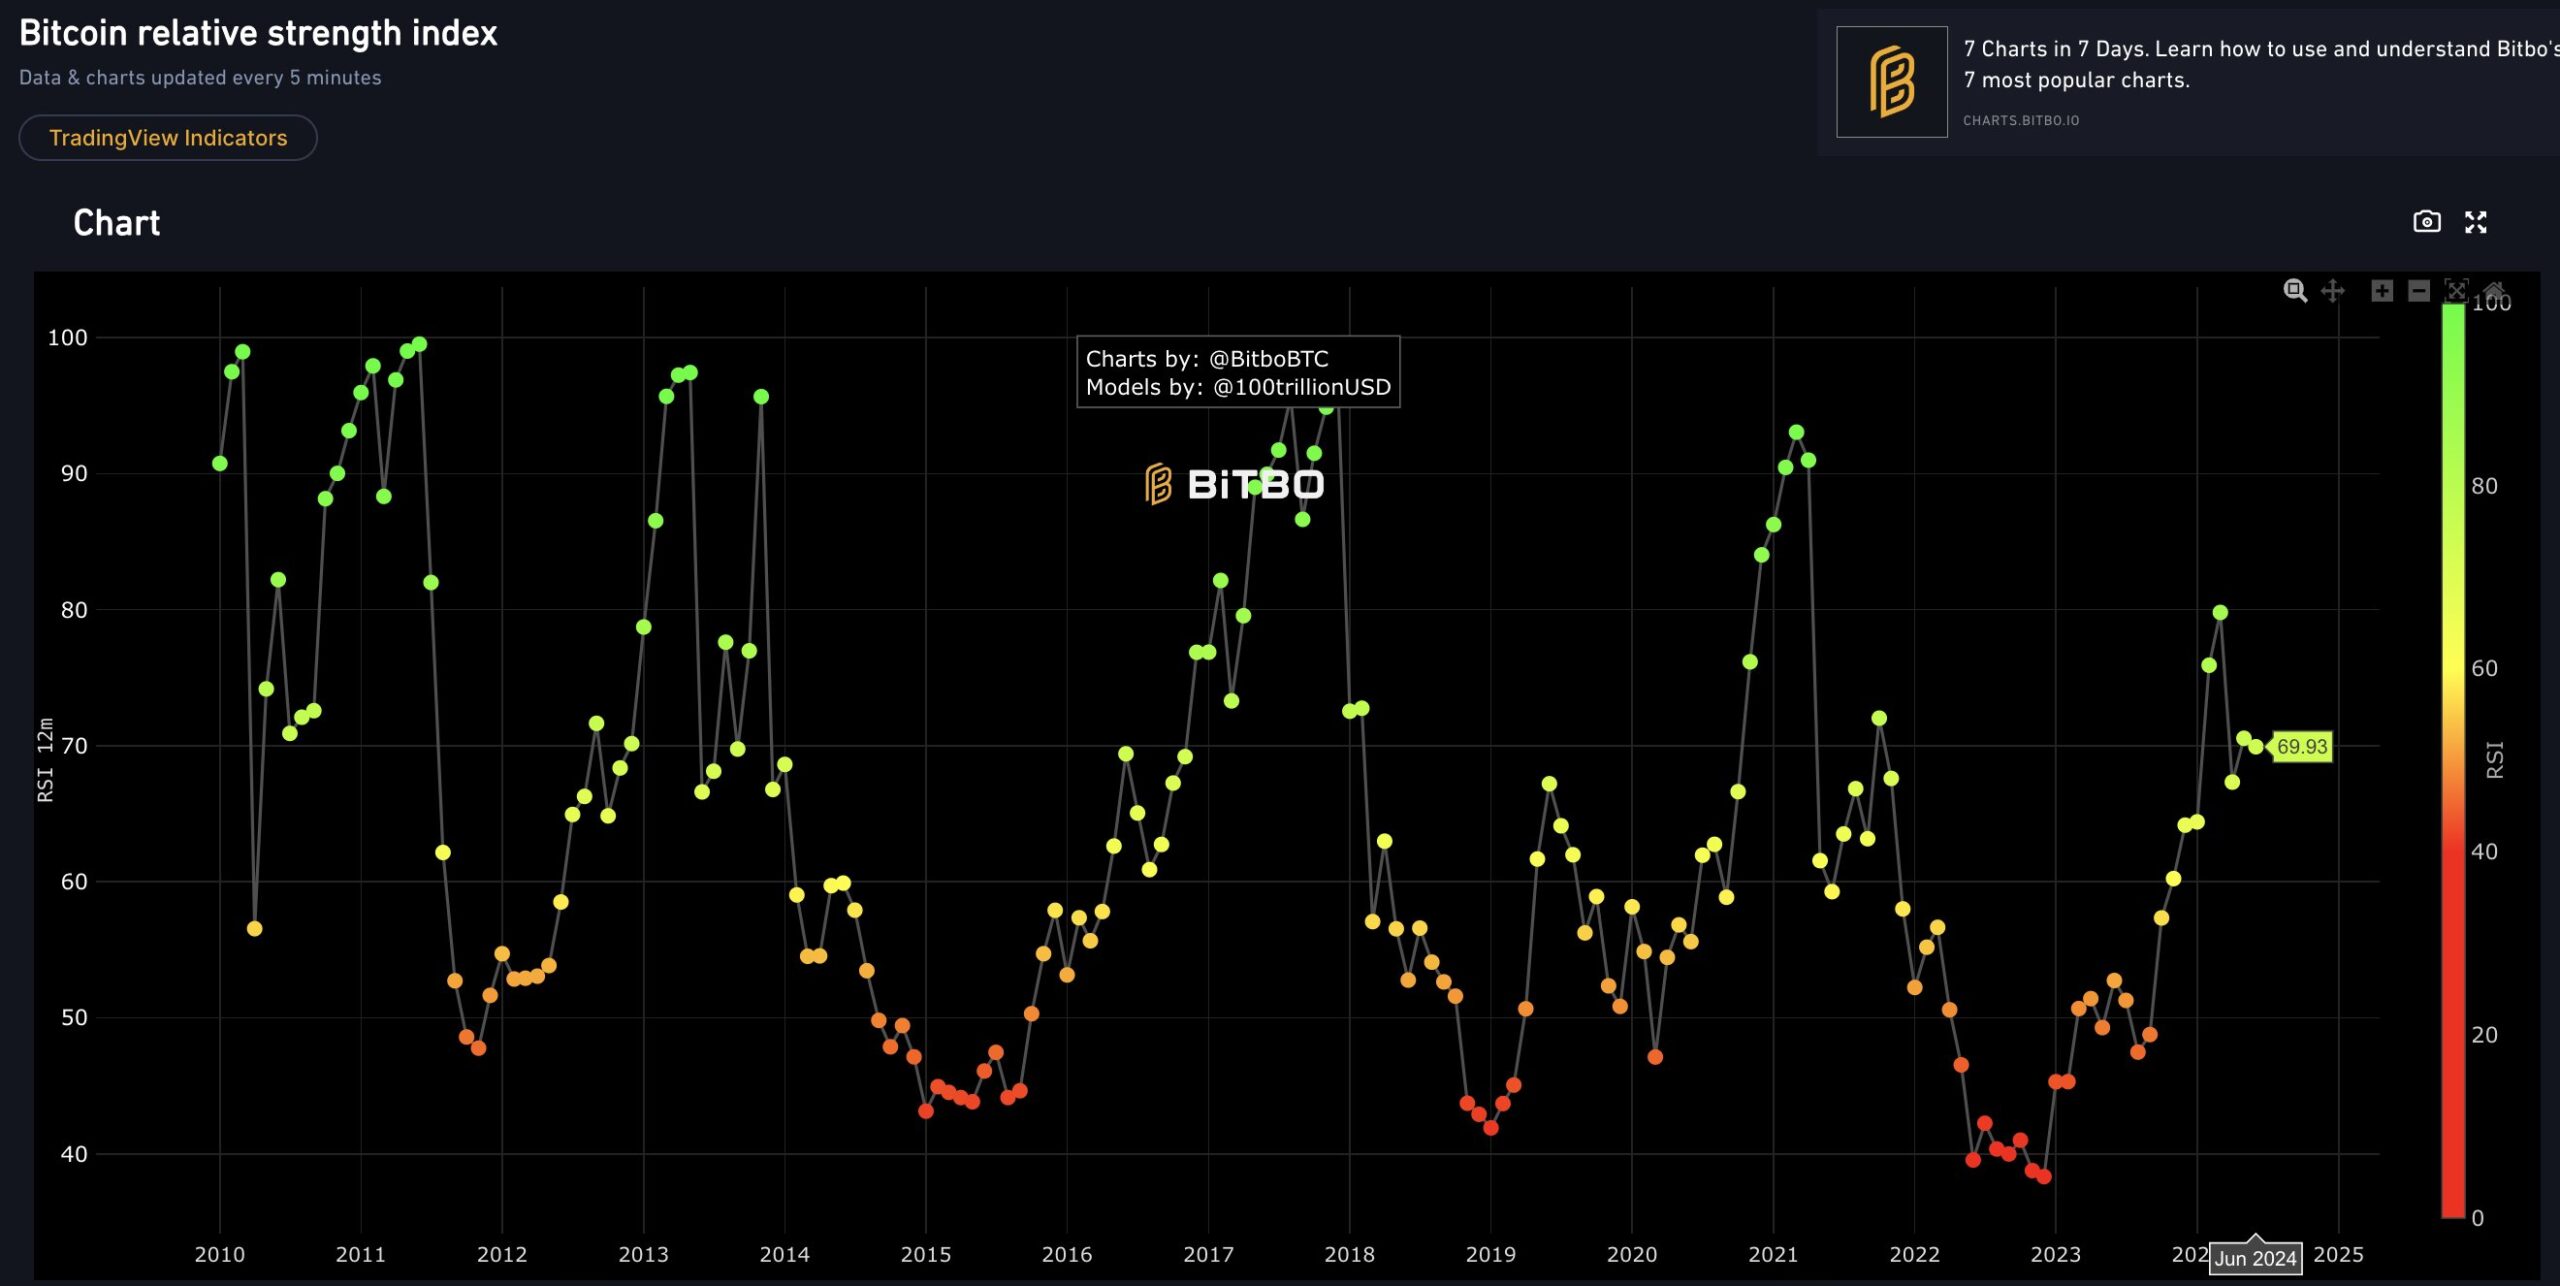
Relative Strength Index (RSI)
This is the first indicator that investors learn. If the RSI is above 70, it indicates overbought conditions, and if it’s below 30, it indicates oversold conditions. When above 70, the likelihood of a price drop increases, and the opposite is expected when below 30. This is something investors memorize. The current RSI is 69.93, and compared to previous data, we cannot say that BTC has reached its peak. So, according to this indicator, it still seems possible to buy and sell BTC at a higher level.
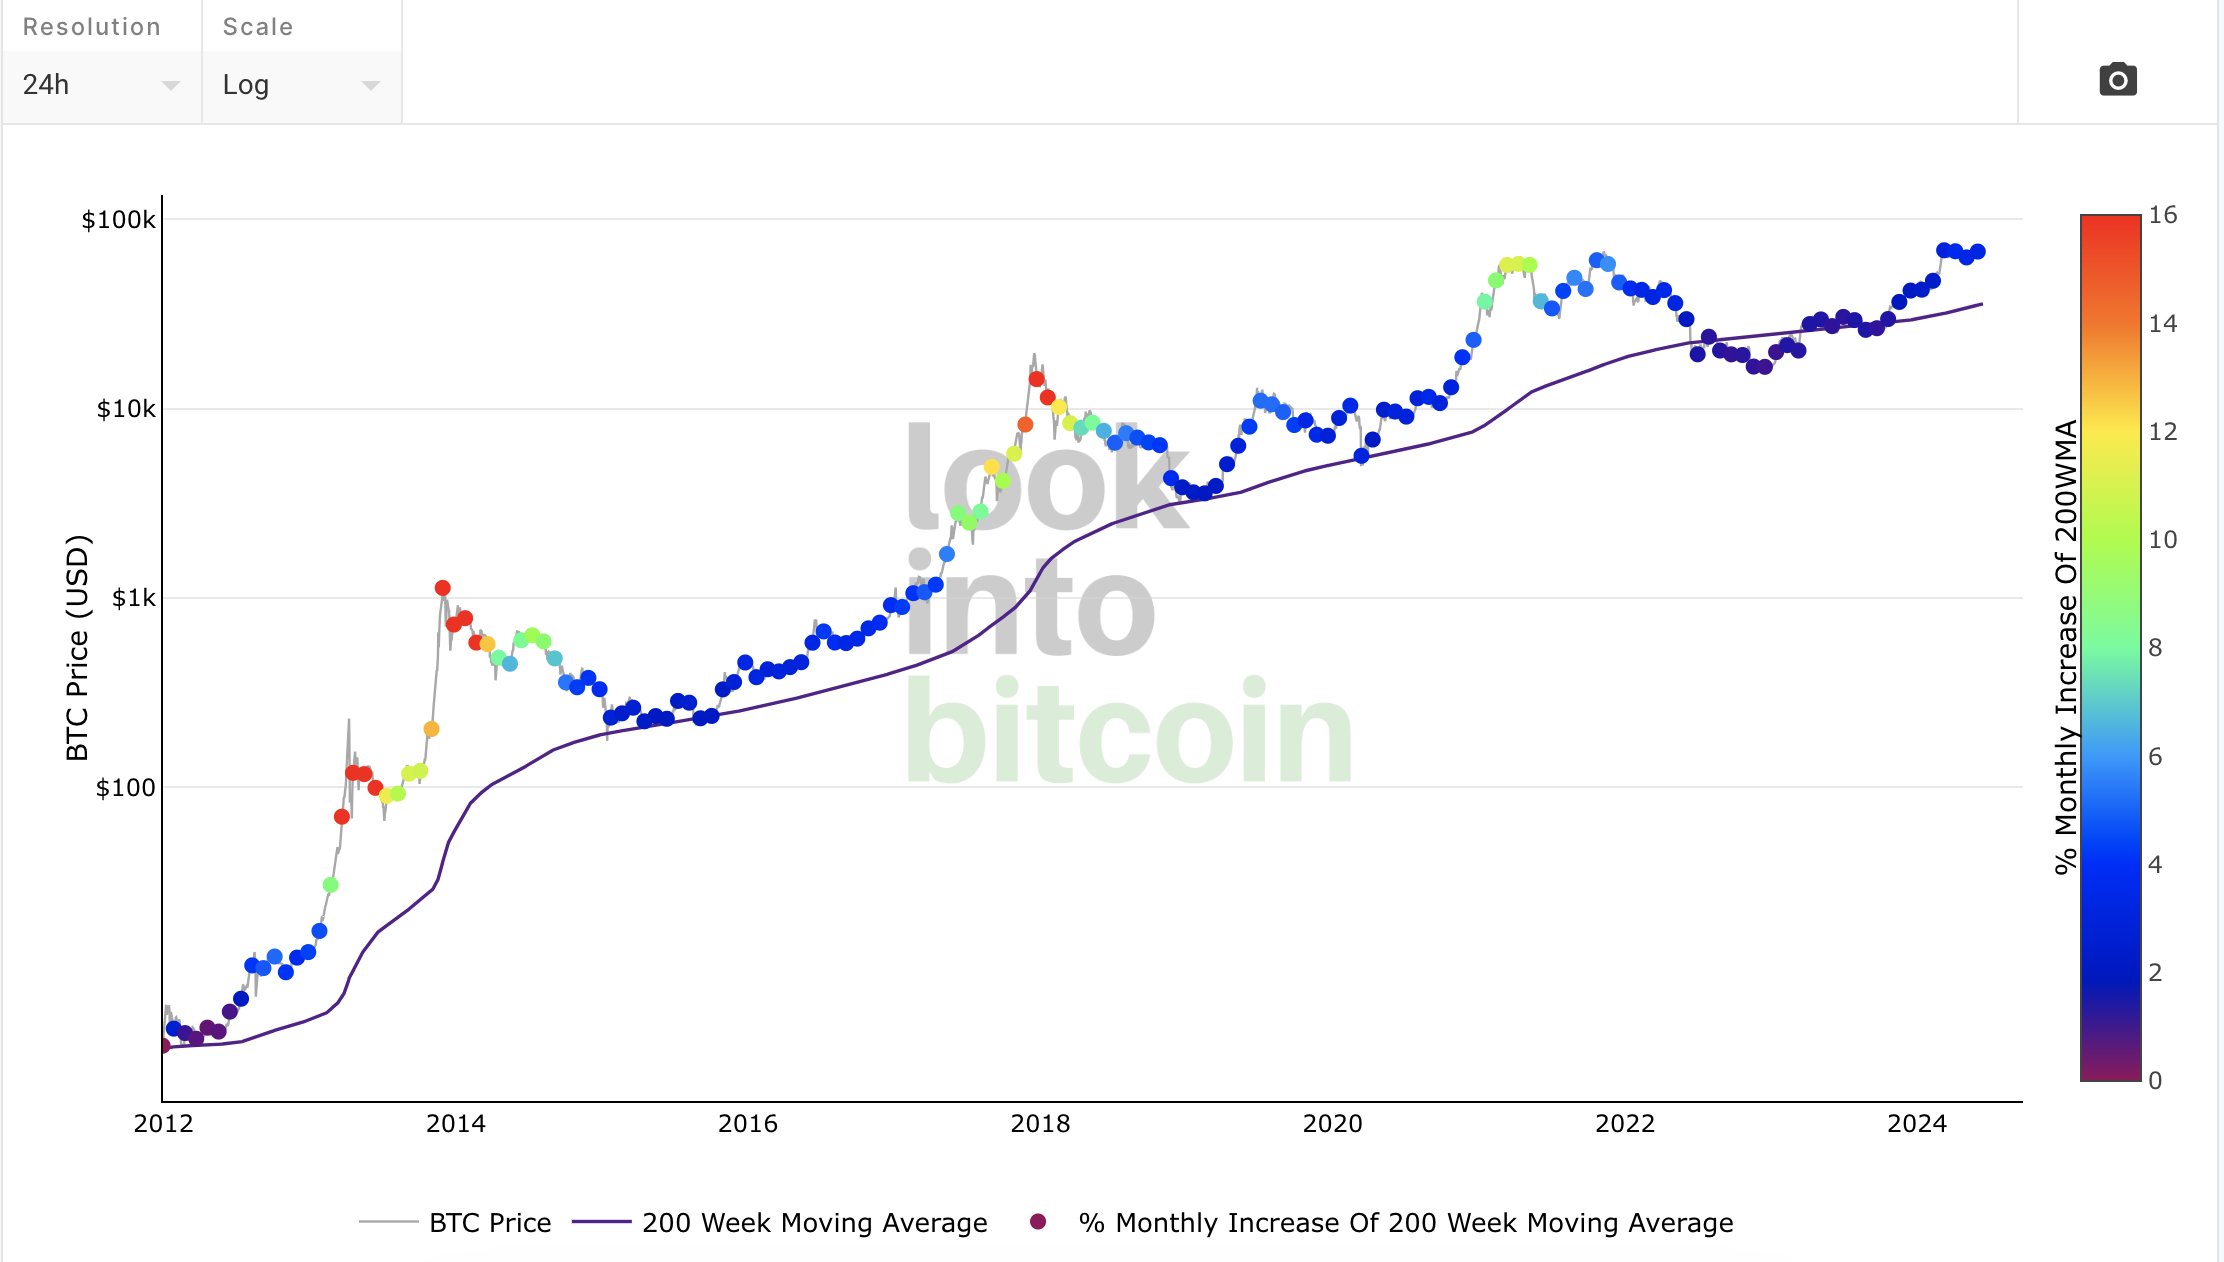
200-Week Moving Average Heatmap
The 200-Week Moving Average Heatmap shows that the current price point is blue, indicating that the price has not yet reached its peak and it is a time to wait and buy. The third indicator also suggests we are in a good time.

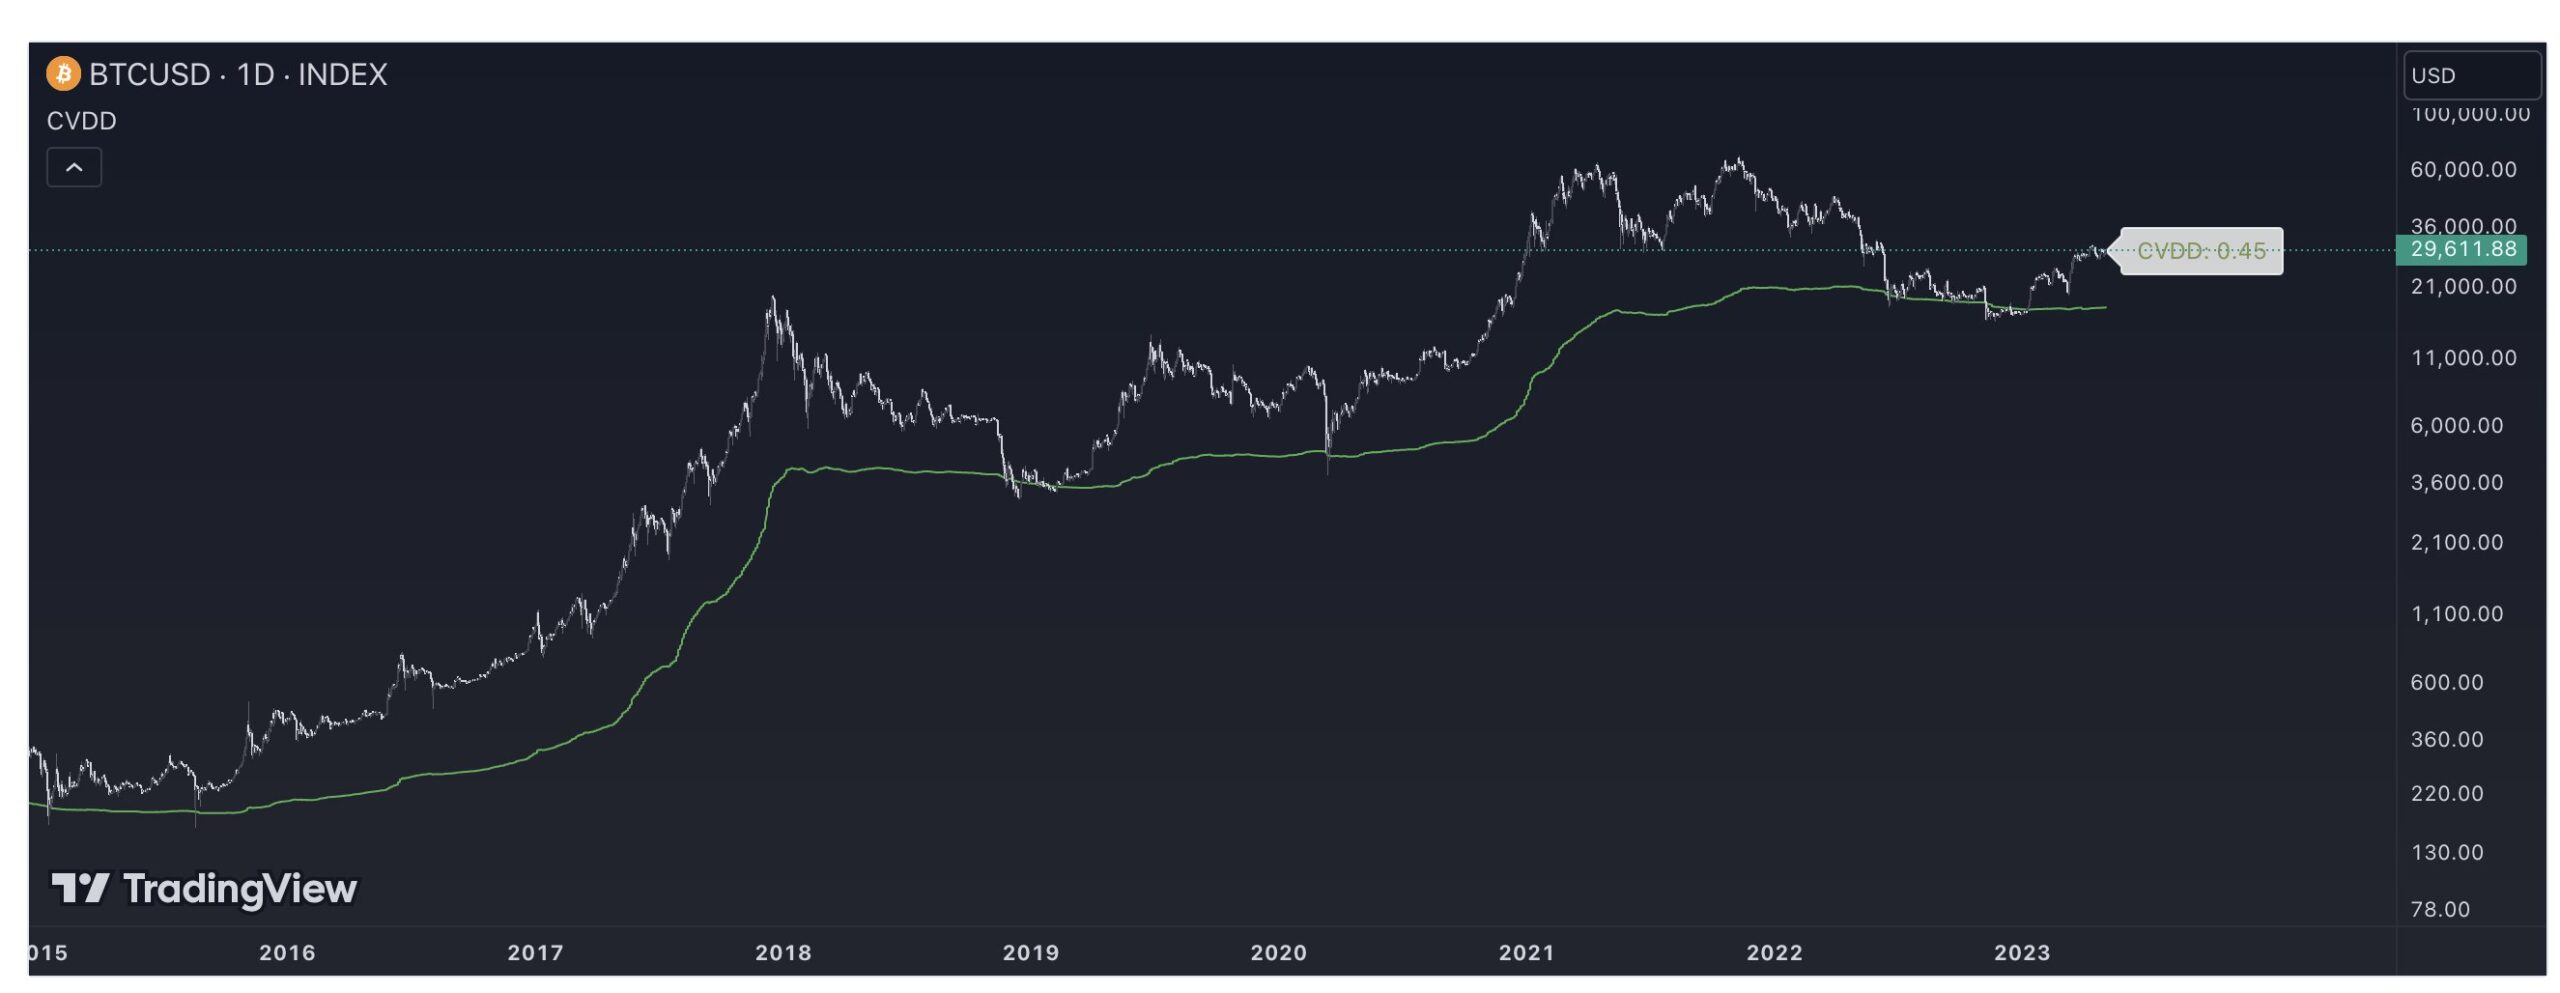
CVDD
When the BTC price touches the green line, BTC price is below its value, and this is a good buying opportunity. The current level indicates that we are not yet at the peak. This could encourage those considering buying BTC at around $65,200.
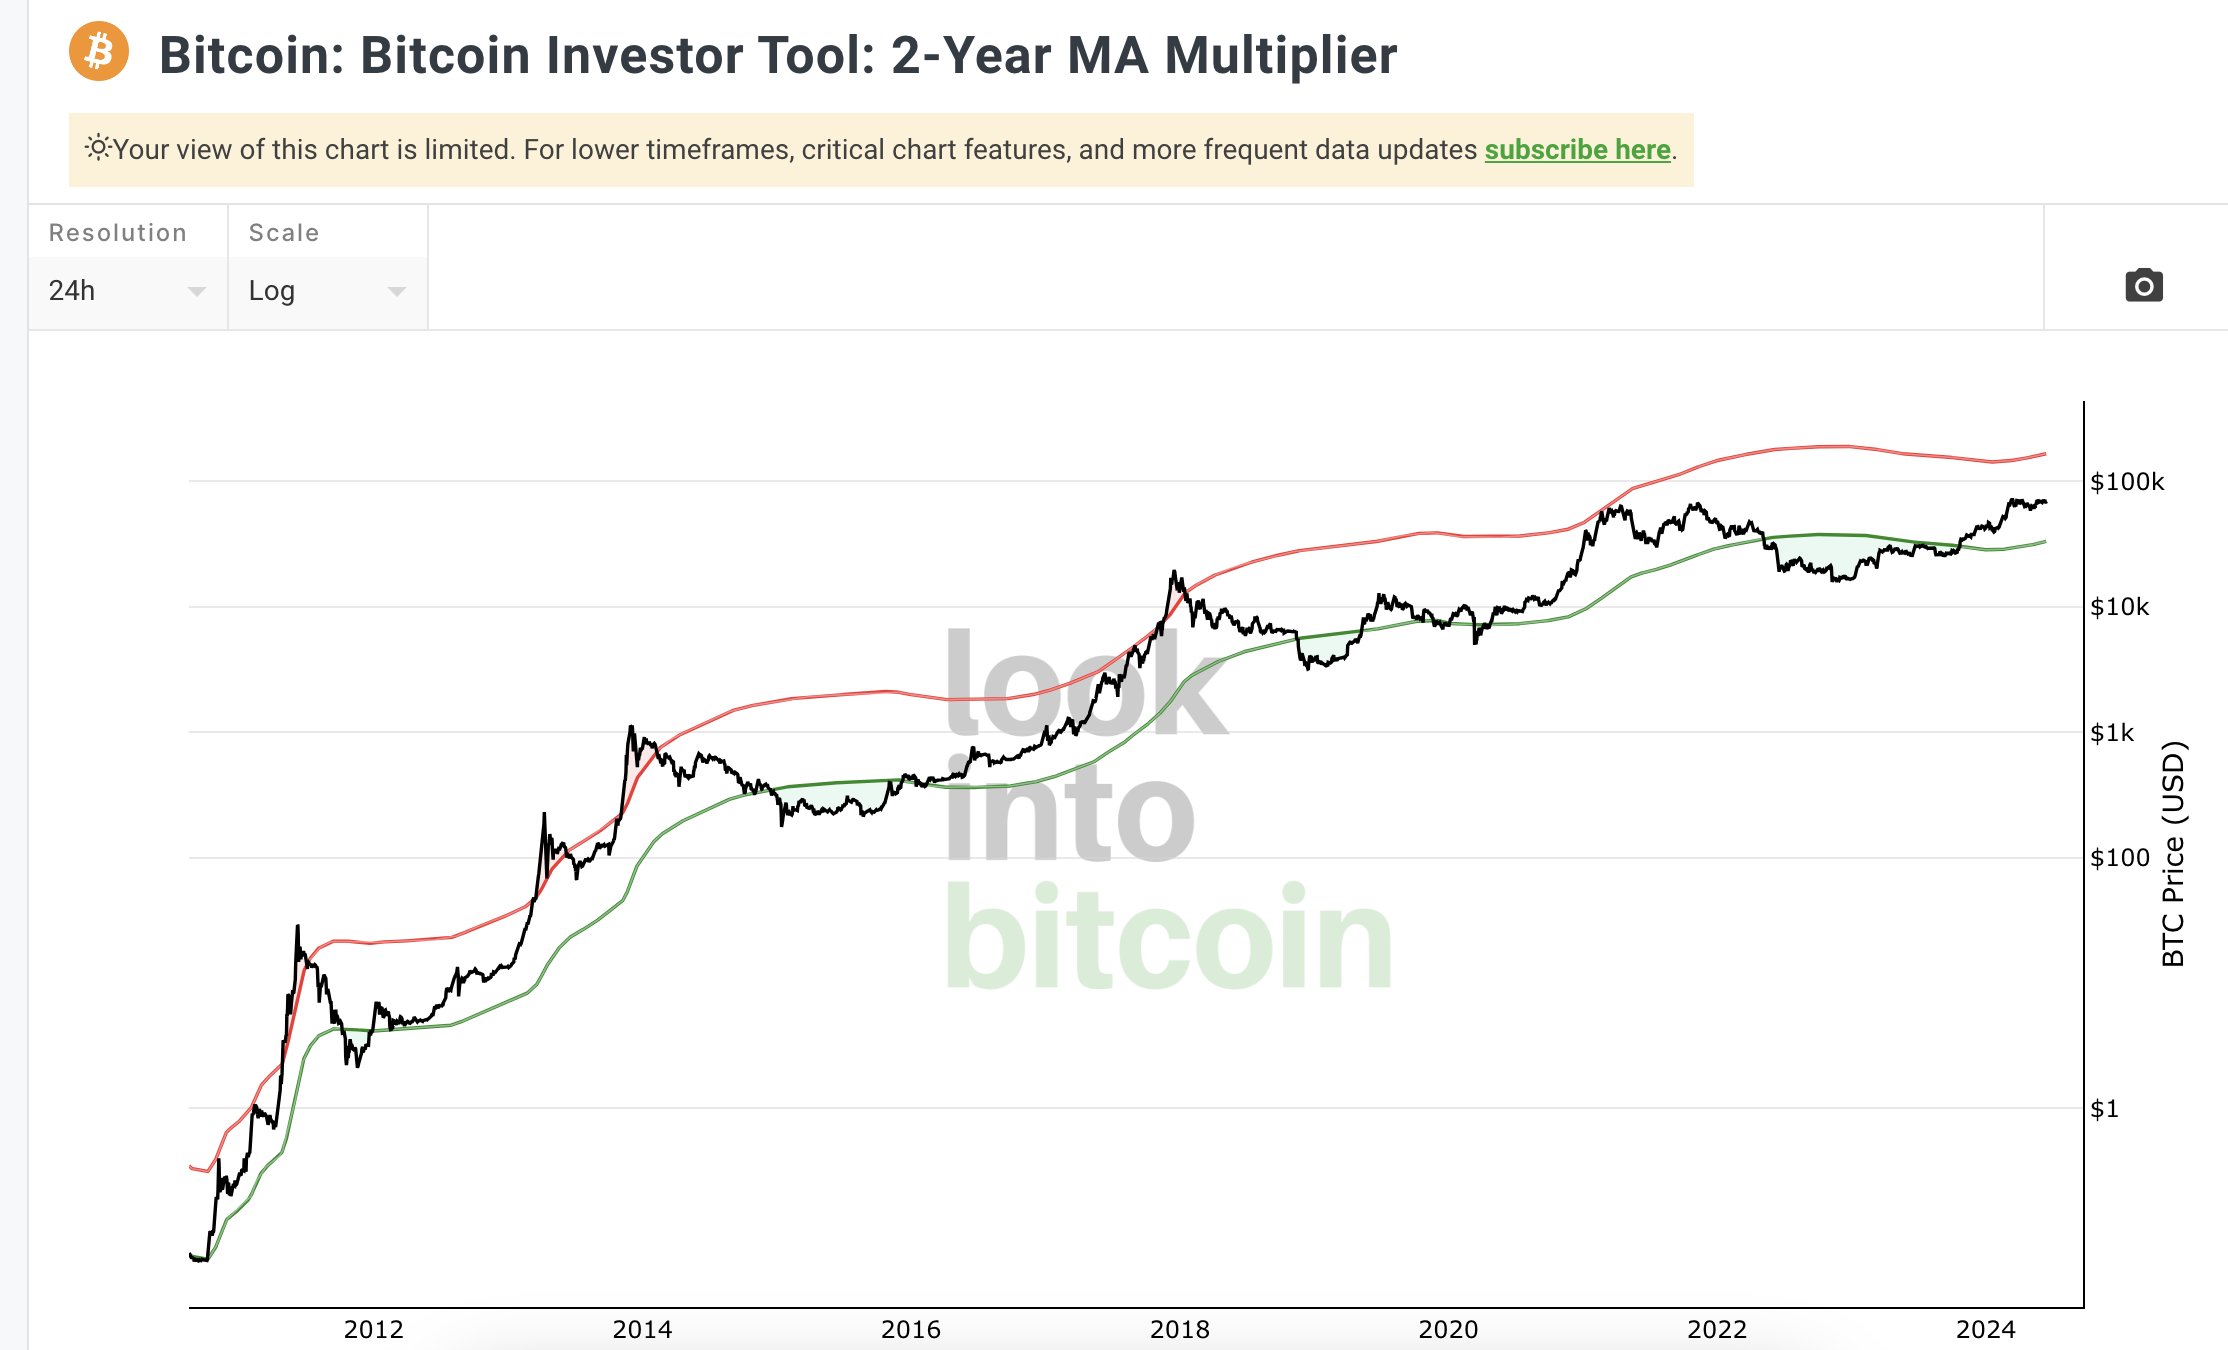
2-Year MA Multiplier
The last indicator, the 2-Year MA Multiplier, shows that the BTC price is between the red and green lines. It hasn’t touched the red line, and the market hasn’t yet peaked. So, all five indicators, which are historically considered successful, tell us that we are not yet at the top.
Can all five be wrong at the same time? Of course, they can; cryptocurrencies are always full of surprises, but historical data suggests that the likelihood of them being wrong is lower. Investors should create their strategies based on their own research, not on indicators, analysts, fortune tellers, or writers. No one can see the future, and when you experience a loss, blaming yourself is less painful than blaming someone else.