One of the popular meme coins, Shiba Inu (SHIB), experienced a drop of over 12% last week. Despite this decline, signs indicate that SHIB might be on the verge of a significant bull rally. A deeper analysis of the current market conditions and technical indicators suggests that the meme coin could reclaim its highest levels before March.
SHIB Price
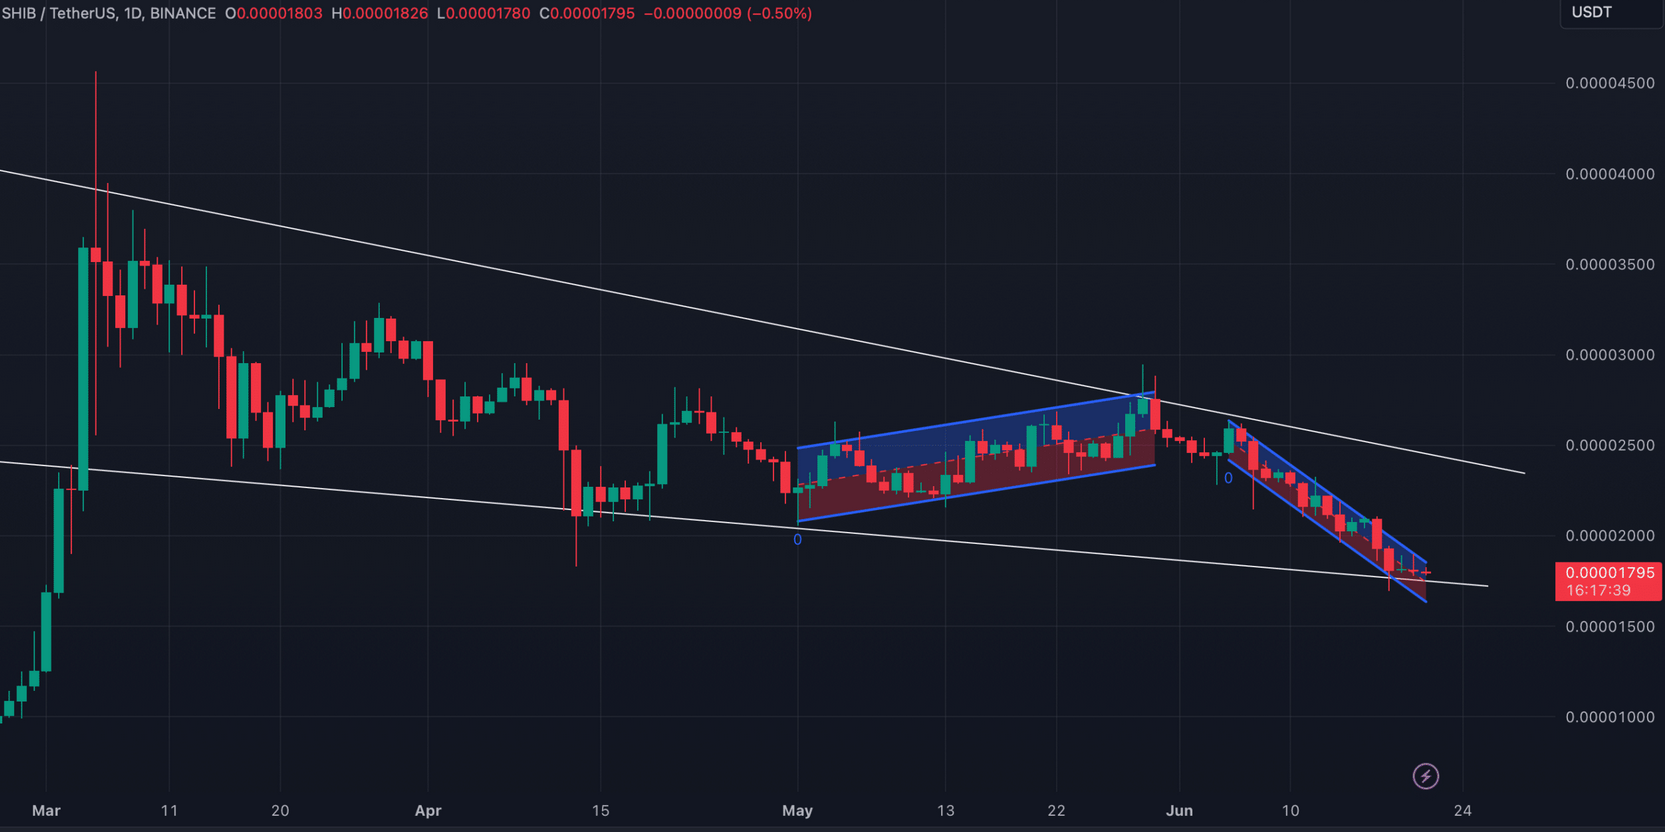
Data showed that Shiba Inu faced a double-digit price drop over the past seven days. Accordingly, the current trading price is $0.00001795 at the time of writing. The cryptocurrency’s market value has exceeded $10.58 billion.

Along with this drop, there was a change in the profitability rate of SHIB investors. Accordingly, only 52% of Shiba Inu investors are in profit. This situation indicates that token holders might enter a waiting mode for a while, which is not very negative in terms of market sentiment.
Technical Analysis Shows Bullish Formation for SHIB
A detailed look at the price charts shows that SHIB has been consolidating in a rising wedge known as a bullish formation since early March. This formation typically indicates a potential upward breakout.
The cryptocurrency SHIB encountered resistance twice at the upper boundary of this wedge but is currently testing the support level. A successful test followed by a breakout could potentially trigger a bull rally, allowing SHIB to reach its previous high levels.

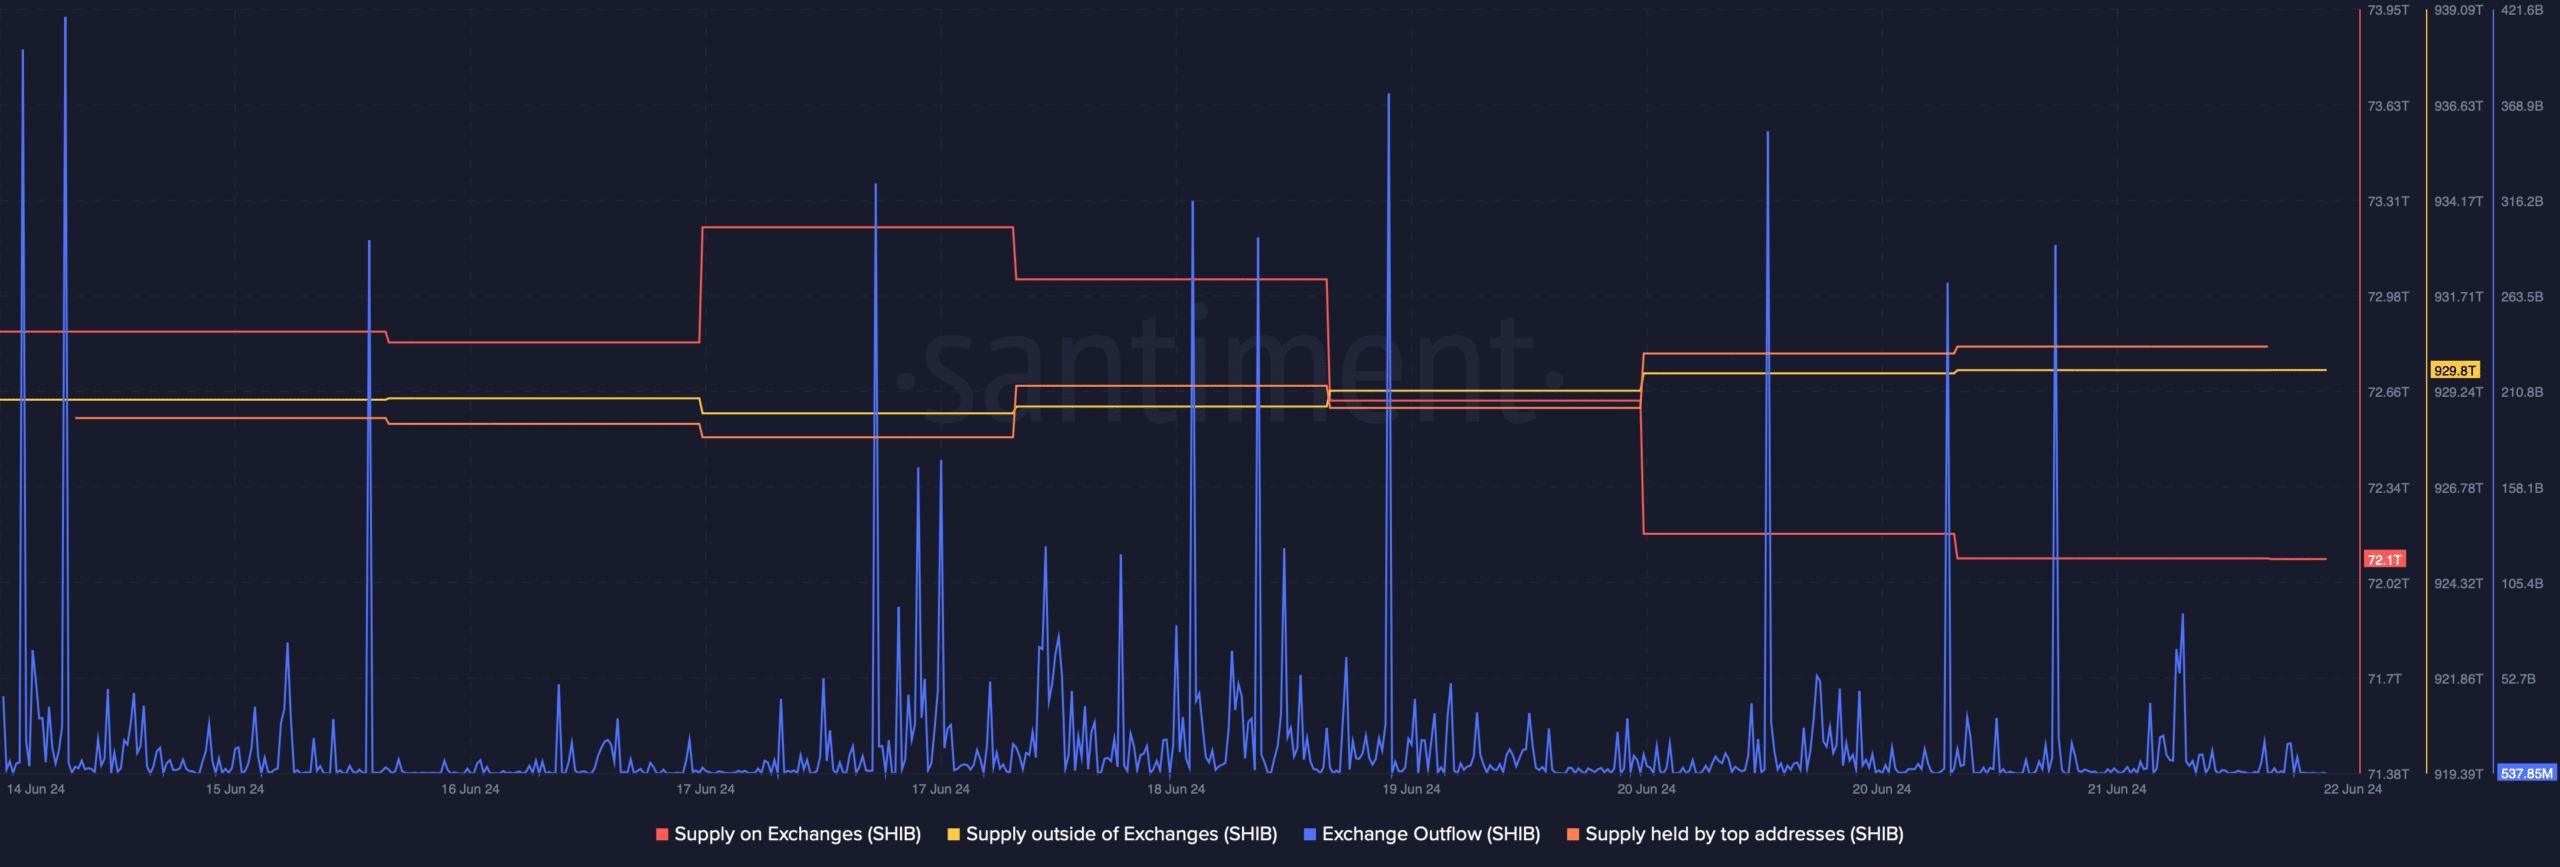
Some on-chain metrics provide further evidence that the trend might reverse. Over the past week, there has been a noticeable increase in buying pressure on SHIB, as indicated by the sudden rise in exchange outflows.
Whale Activity and Other Indicators
The activities of large investors or “whales” have also become noteworthy. Accordingly, the SHIB supply held by top addresses has increased in recent days. This indicates that token holders expect an increase. Additionally, the Fear and Greed Index for SHIB entered the “fear” category at 36%. The fear category typically forms before general price increases.

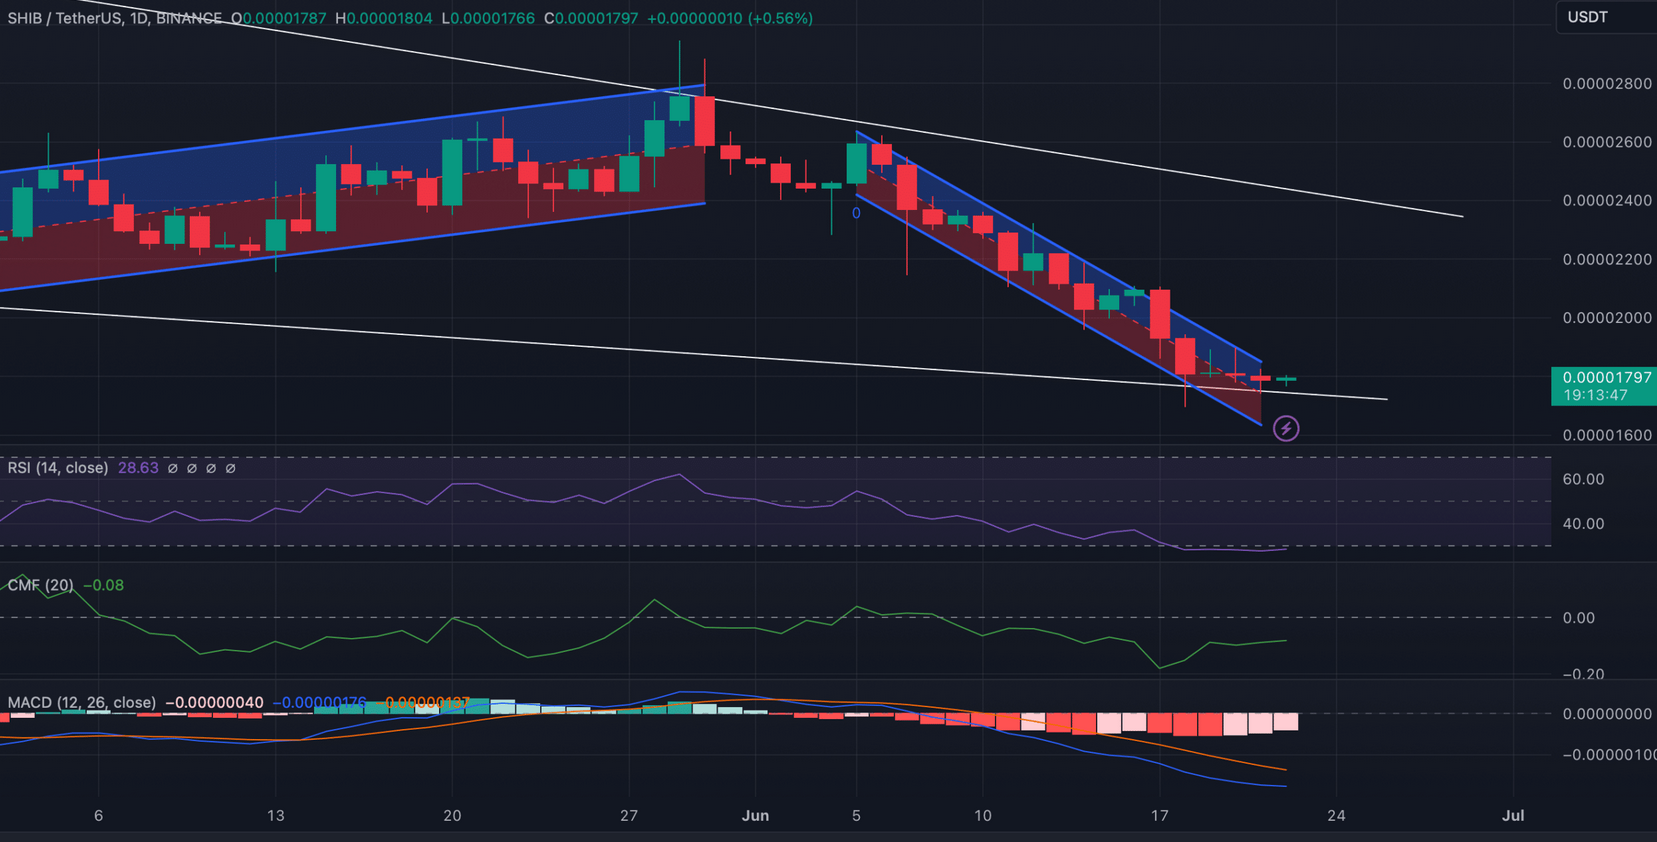
Examining SHIB’s daily chart, the Relative Strength Index (RSI) is currently in the oversold region. My interpretation of this situation is that the selling pressure might have been excessive, potentially paving the way for a price recovery. Additionally, the Chaikin Money Flow (CMF), which measures the flow of money into and out of an asset, showed an increase, indicating rising investor interest and potential inflows into SHIB.
Despite the positive signals, the Moving Average Convergence Divergence (MACD) indicator still supports sellers, showing a bearish advantage. This mixed signal indicates that while there are signs of a potential rally, the market is still in a cautious phase.

 Türkçe
 Español


