COINTURK NEWSCOINTURK NEWSCOINTURK NEWS
  • Real-Time News Feed
  • Bitcoin
  • Altcoin
  • Ethereum
  • Technology News
  • Advertise
  • Contact
  • TURTURTUR
  • ESESES
Search
© 2024 COINTURK NEWS. All Rights Reserved.
Reading: Polkadot Breaks Falling Wedge Pattern to Signal Uptrend
Share
Languages
  • TürkçeTürkçe
  • EspañolEspañol
Font ResizerAa
COINTURK NEWSCOINTURK NEWS
Font ResizerAa
Search
  • Real-Time News Feed
  • Bitcoin
  • Altcoin
  • Ethereum
  • Technology News
  • Advertise
  • Contact
  • TURTURTUR
  • ESESES
Follow US
© 2025 BLOCKCHAIN Information Technologies. >> COINTURK NEWS
Powered by LK SOFTWARE
COINTURK NEWS > Polkadot (DOT) > Polkadot Breaks Falling Wedge Pattern to Signal Uptrend
Polkadot (DOT)

Polkadot Breaks Falling Wedge Pattern to Signal Uptrend

In Brief

  • Polkadot broke its falling wedge pattern, indicating a potential uptrend.

  • The Relative Strength Index (RSI) shows increased buying pressure.

  • Parabolic SAR indicator confirms the bullish trend since July 11.

COINTURK NEWS
COINTURK NEWS 11 months ago
Share
SHARE

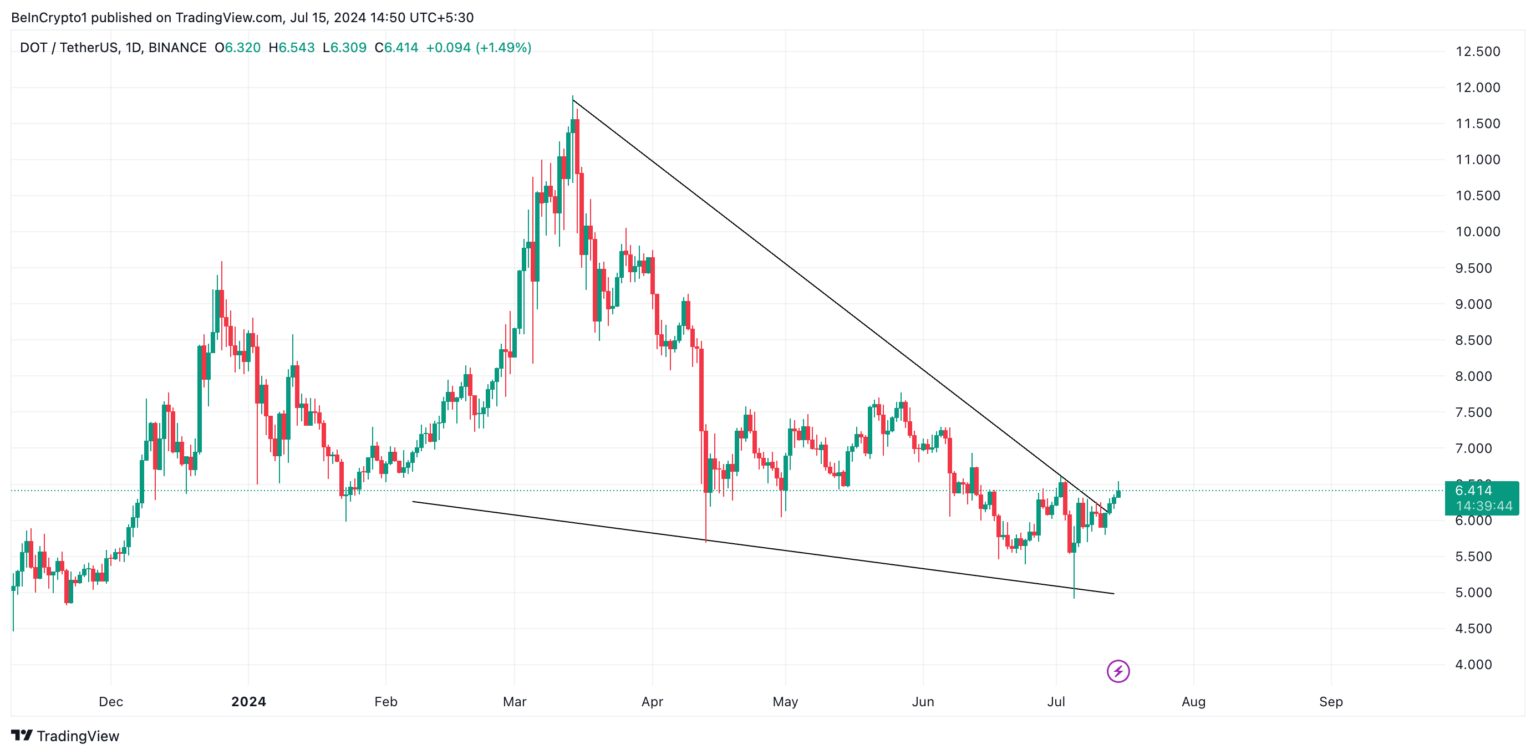
Polkadot’s price surge last week led to a breakout from the falling wedge pattern it had been following since March. As of the time of writing, the altcoin is trading at $6.47, marking its highest price point in seven days. The falling wedge pattern forms when an asset’s price moves between two downward-sloping trend lines. The upper trend line acts as a resistance level, while the lower trend line serves as support.

Contents
What’s Happening with Polkadot?DOT Chart Analysis

What’s Happening with Polkadot?

When an asset’s price breaks out from the upper trend line of a falling wedge, it is generally considered a bullish signal. This breakout indicates that buyers are pressuring sellers and the price may enter an uptrend. Polkadot broke this upper line on July 13 and has maintained its upward trend since then.

Additionally, at the time of writing, Polkadot’s Relative Strength Index (RSI) is at 57.81, confirming the increase in buying pressure over selling activity.

This indicator measures an asset’s overbought and oversold conditions and ranges from 0 to 100; values above 70 indicate that the asset is overbought and a price drop is expected, while values below 30 suggest that the asset is oversold and a recovery might be imminent. The rising RSI of DOT at 57.81 points to a steady increase in buying activities.

DOT Chart Analysis

The bullish trend for DOT has been increasing since July 11. This can be observed from the setup of the SAR indicator on the daily chart. Since July 11, the points of this indicator have been positioned below DOT’s price, following a month of being above the altcoin’s price.

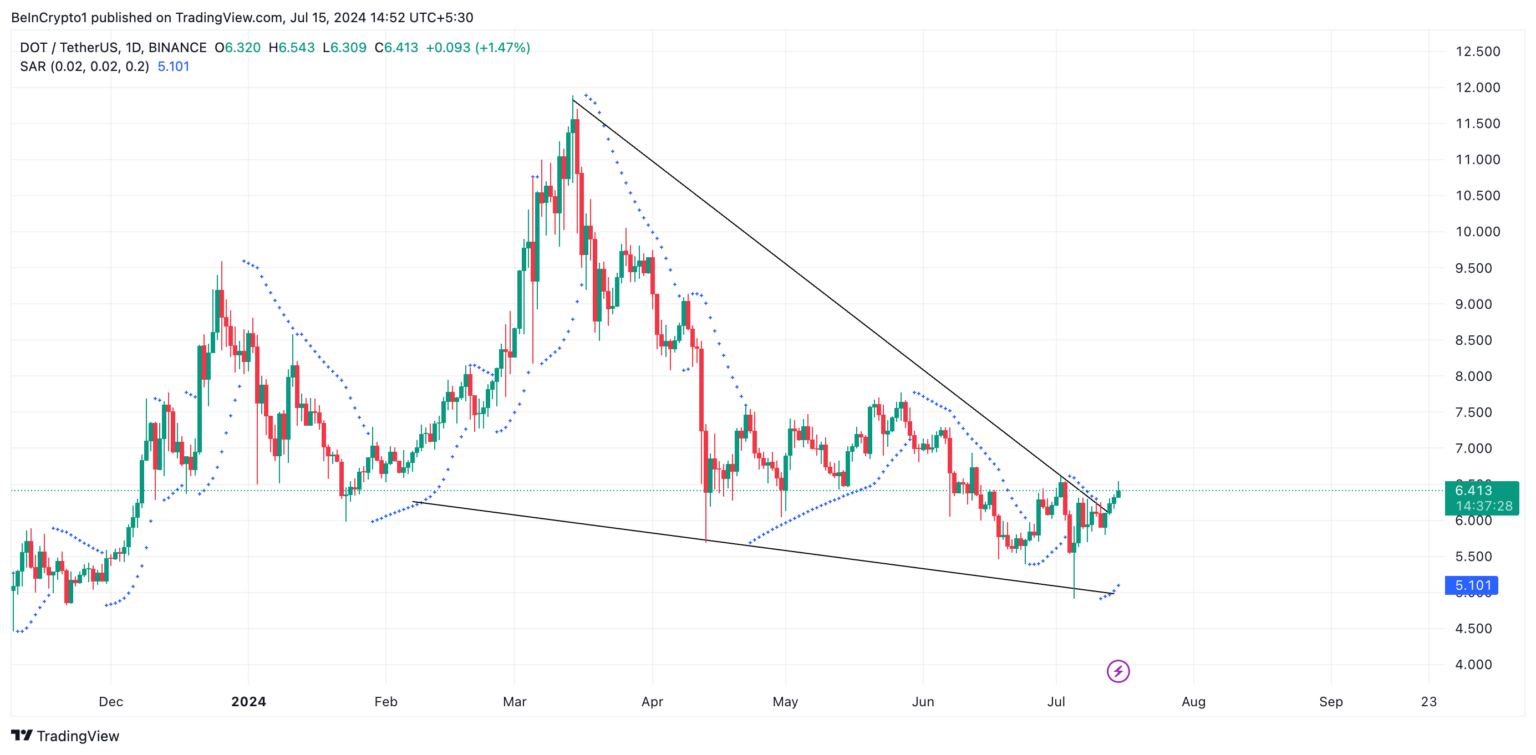
The Parabolic SAR indicator measures an asset’s trend direction and identifies potential reversal points. When the indicator’s points are placed below the price, it signals an uptrend. This suggests that the asset’s price will continue to rise. As the market is currently in an uptrend, investors generally interpret this as a signal to hold long positions or consider entering new long positions.

Conversely, when the points are above the price, it indicates that the asset’s price will continue to fall. Considering new short positions is seen as a bearish signal. The bullish sentiment following DOT has been confirmed by the Parabolic SAR indicator’s points remaining below its price. If demand for the altcoin continues, it could trade above $6.57.

You can follow our news on Telegram, Facebook, Twitter & Coinmarketcap
Disclaimer: The information contained in this article does not constitute investment advice. Investors should be aware that cryptocurrencies carry high volatility and therefore risk, and should conduct their own research.

You Might Also Like

SEC Extends Review Time for Grayscale Polkadot ETF Application

Grayscale Seeks Approval for Polkadot Trust, Could Boost DOT’s Market Appeal

DOT Price Surges Following 21Shares’ ETF Filing

Trump’s Comments Shake Crypto Markets as 21Shares Files for DOT Coin ETF

Polkadot Shows Significant Growth Above $8, Signaling Price Momentum

COINTURK NEWS 15 July, 2024 - 5:45 pm 15 July, 2024 - 5:45 pm
Share This Article
Facebook Twitter
Share
Previous Article Moody’s Predicts Potential Rate Cuts for BTC Investors
Next Article Dogwifhat Achieves Remarkable Growth in Early 2024
Leave a comment

Leave a Reply Cancel reply

Your email address will not be published. Required fields are marked *

This site uses Akismet to reduce spam. Learn how your comment data is processed.

Stay Connected

8.1k Like
21.1k Follow
1.1k Follow

Latest News

Donald Trump’s Unexpected Boost to PEPE Coin’s Market Dynamics
Altcoin News
Coinbase Expands 24/7 Trading to XRP and SOL Futures
Altcoin News
Bitcoin Faces a Chill as Rapid Market Shifts Occur
Cryptocurrency News
SEC Offers Clarity for Altcoin Staking Participants
Altcoin News
//

COINTURK was launched in March 2014 by a group of technology enthusiasts who believe that Bitcoin will be as important as the internet in the world of the future thanks to the amazing technology underlying it.

CRYPTOCURRENCY LIVE PRICES

  • Bitcoin (BTC) Live Price
  • Ethereum (ETH) Live Price
  • Ripple (XRP) Live Price
  • Solana (SOL) Live Price
  • Dogecoin (DOGE) Live Price
  • Cardano (ADA) Live Price
  • Chainlink (LINK) Live Price

OUR PARTNERS

  • COINMARKETCAP
  • COINGECKO
  • BITCOINHABER
  • BH NEWS
  • 21MILYON
  • NEWSLINKER

OUR COMPANY

  • About Us
  • Cookie Policy
  • Advertising
  • Contact
COINTURK NEWSCOINTURK NEWS
Follow US
© 2025 BLOCKCHAIN Information Technologies. >> COINTURK NEWS
Powered by LK SOFTWARE
Welcome Back!

Sign in to your account

Lost your password?