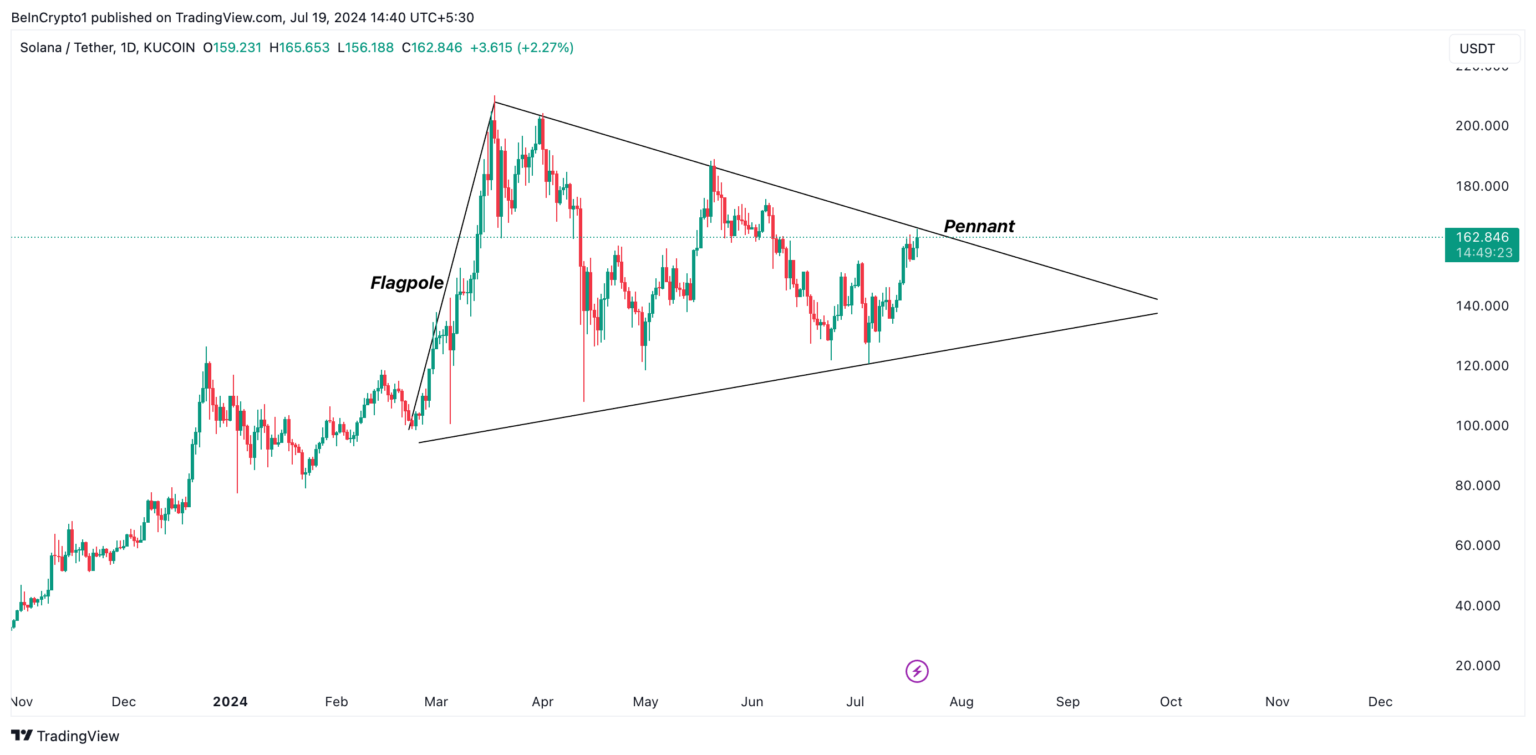
Solana price increased by 19% last week and achieved the highest gains among the top five cryptocurrencies by market value over the past seven days. Daily chart price movements reveal the formation of a bullish flag pattern, indicating the altcoin’s value could rise further.
What’s Happening with Solana?
A bullish flag pattern forms after a strong upward price movement, followed by a consolidation period resembling a small symmetrical triangle. This pattern suggests buyers are pausing temporarily before potentially continuing the uptrend. At the time of writing, SOL is trading at $160 and appears ready to break above the upper trend line of the flag. Investors typically look for a breakout above the upper trend line as a signal to enter long positions.
Additionally, SOL’s Chaikin Money Flow (CMF) is in an uptrend and currently stands above the zero line. This indicator measures the money flow into and out of an asset. A CMF value above zero is a sign of market strength, indicating high buying pressure surpassing selling activity.
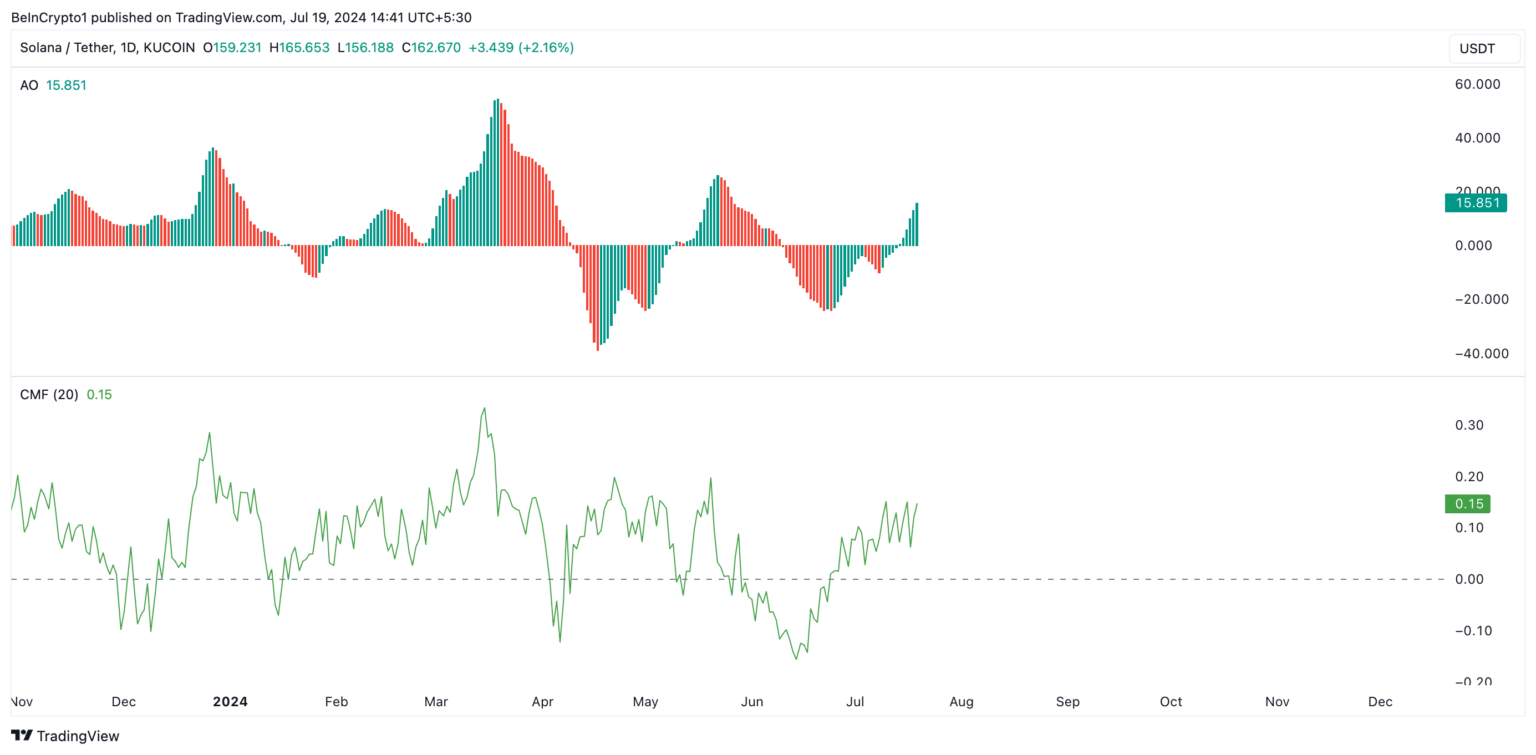
Investors interpret a positive CMF as a harbinger of continuous price increases, especially during periods of price hikes like this.
Notable Details for SOL
Solana’s increasing open interest in futures confirms the bullish sentiment towards the altcoin. At the time of writing, the cryptocurrency’s open interest in futures increased by 18% over the past seven days, reaching $2.19 billion.

Open interest in an asset’s futures represents the total number of outstanding futures contracts. When it rises, it means more investors are entering new positions. If this trend continues, SOL will break above the upper line of the bullish flag pattern, trade at $164.51, and move towards $170.
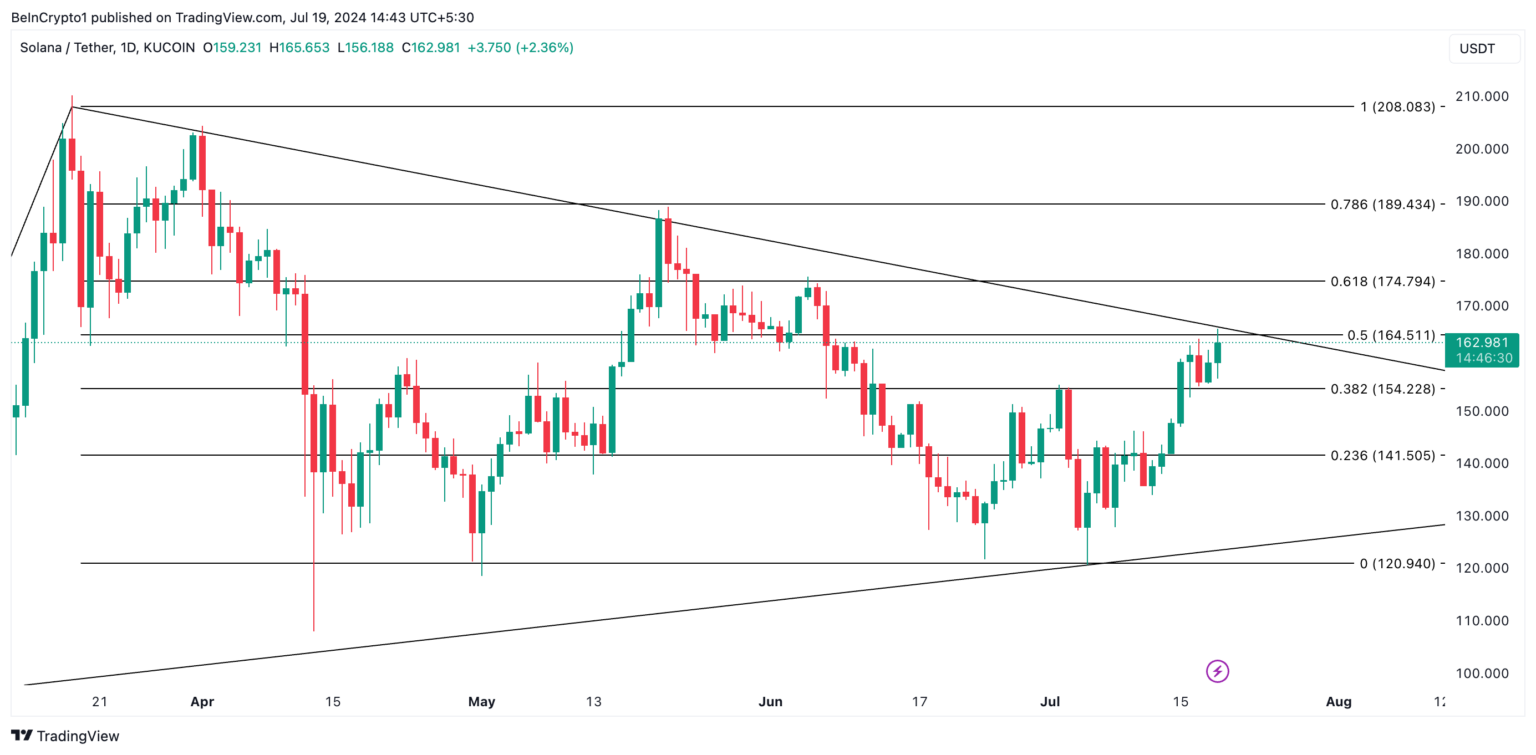
However, if market sentiment shifts from bullish to bearish, SOL’s value could drop to $154.22 and remain in this pattern for a while.

 Türkçe
 Español

