Fantom price dropped 20% in the last 24 hours amid a broader market decline. At the time of writing, the altcoin is trading at $0.29, a low last observed in October 2023. FTM’s recent price drop has caused losses for many investors, with less profitable trades in the spot market and an increase in long liquidations in the futures market.
What is Happening with FTM?
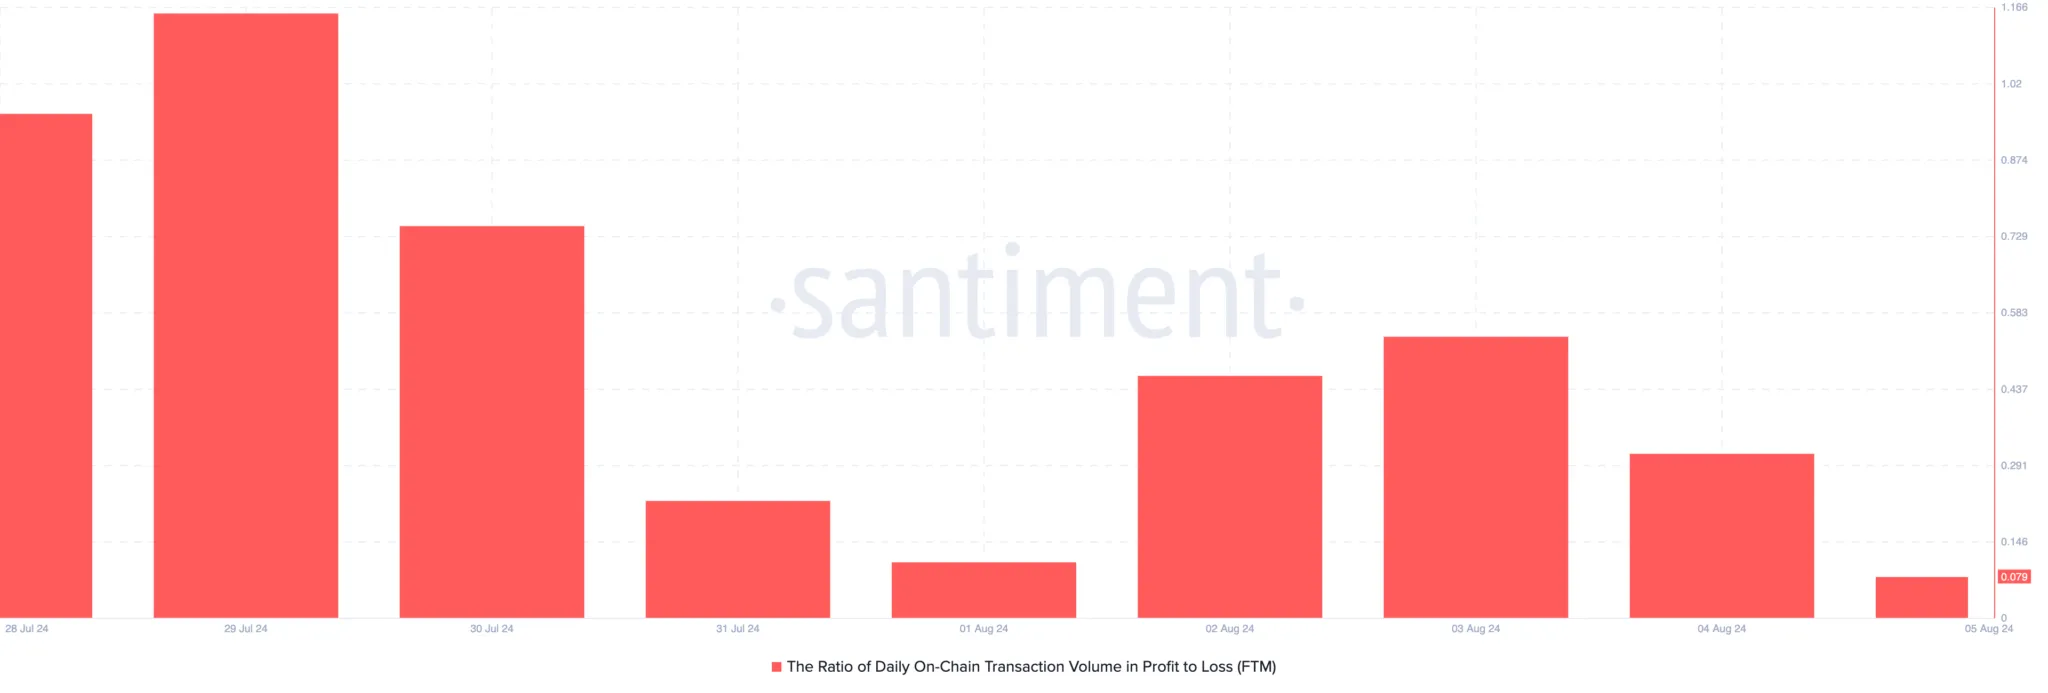
FTM’s daily on-chain transaction volume profit/loss ratio shows that asset holders have seen more losses than profits in the last 24 hours. At the time of writing, the data value was recorded at 0.07. This data measures the total volume of FTM transactions and results in a profit compared to the total daily on-chain transaction volume for the sender. At 0.07, it indicates that for every transaction resulting in a loss today, only 0.07 transactions were profitable.
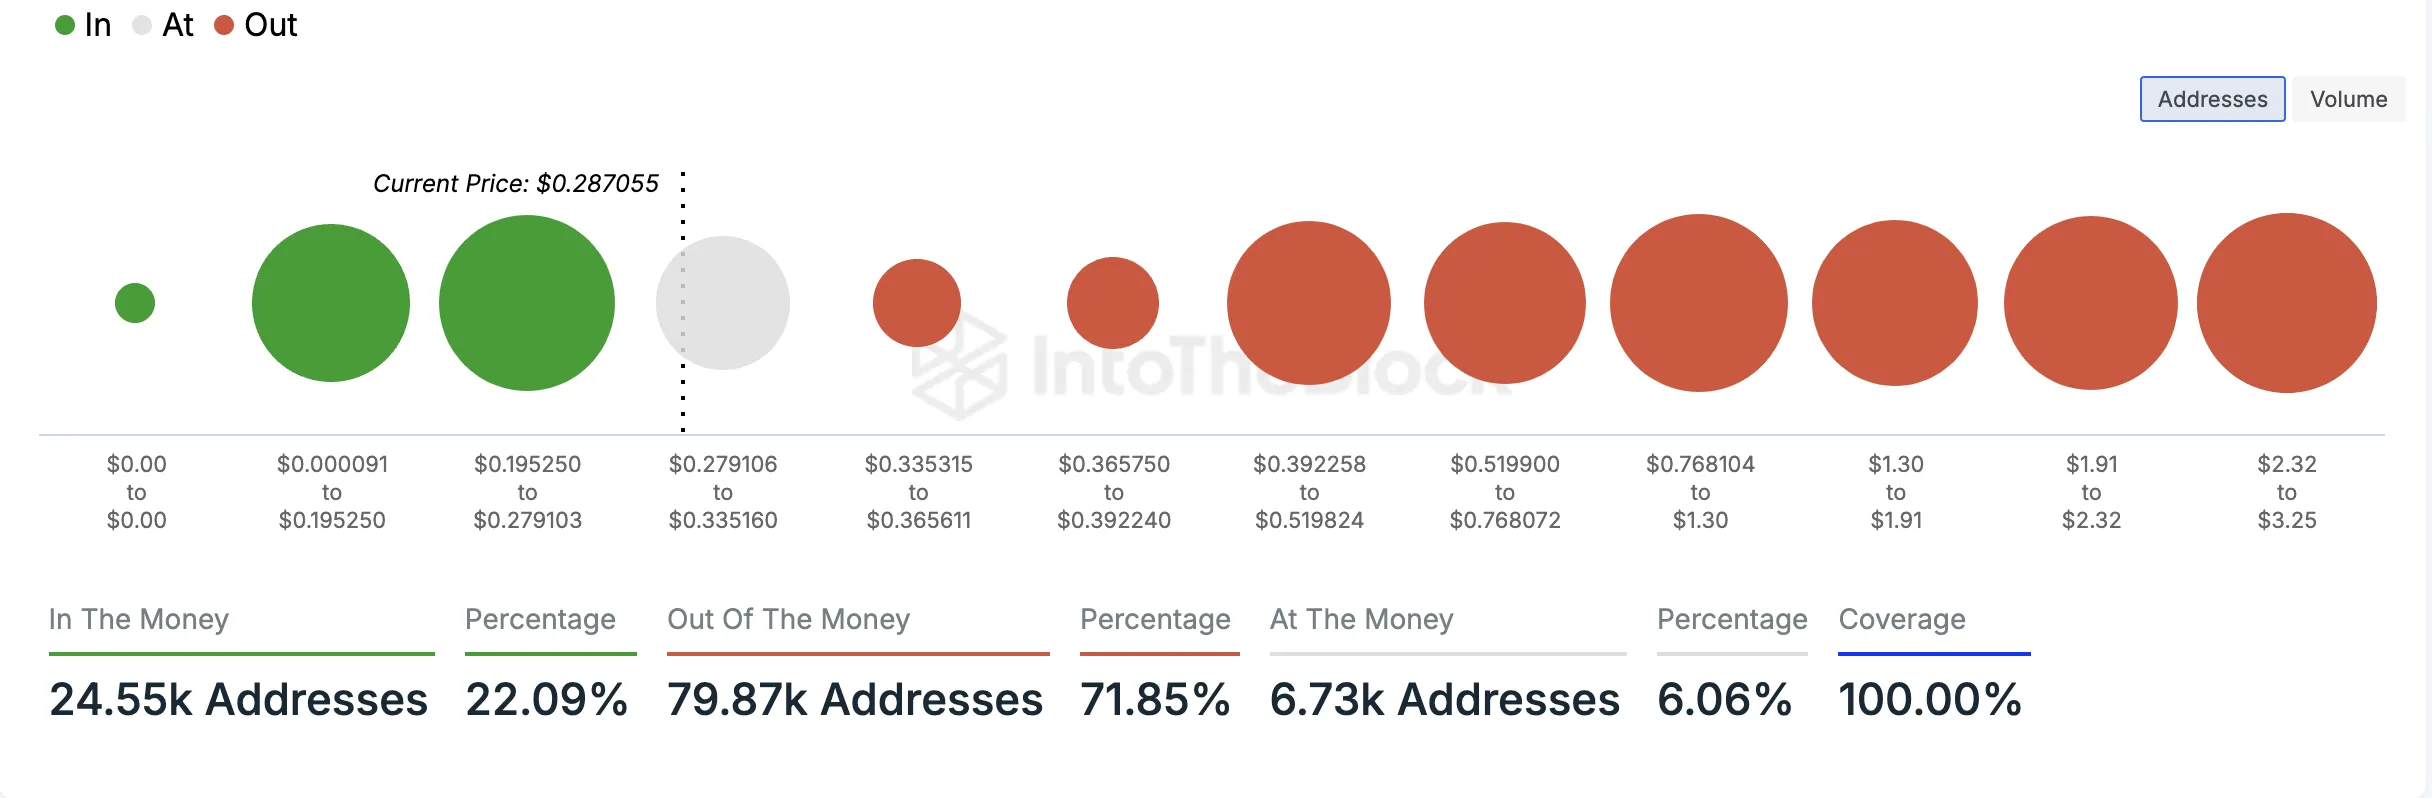
Currently, 80,000 wallet addresses, representing 72% of all holders, are out of the money. According to IntoTheBlock data, an address is considered out of the money if the current market price of an asset is lower than the average cost at which the address acquired the tokens it currently holds. Conversely, only 23,000 addresses, representing 23% of all FTM holders, continue to hold assets with a profit.

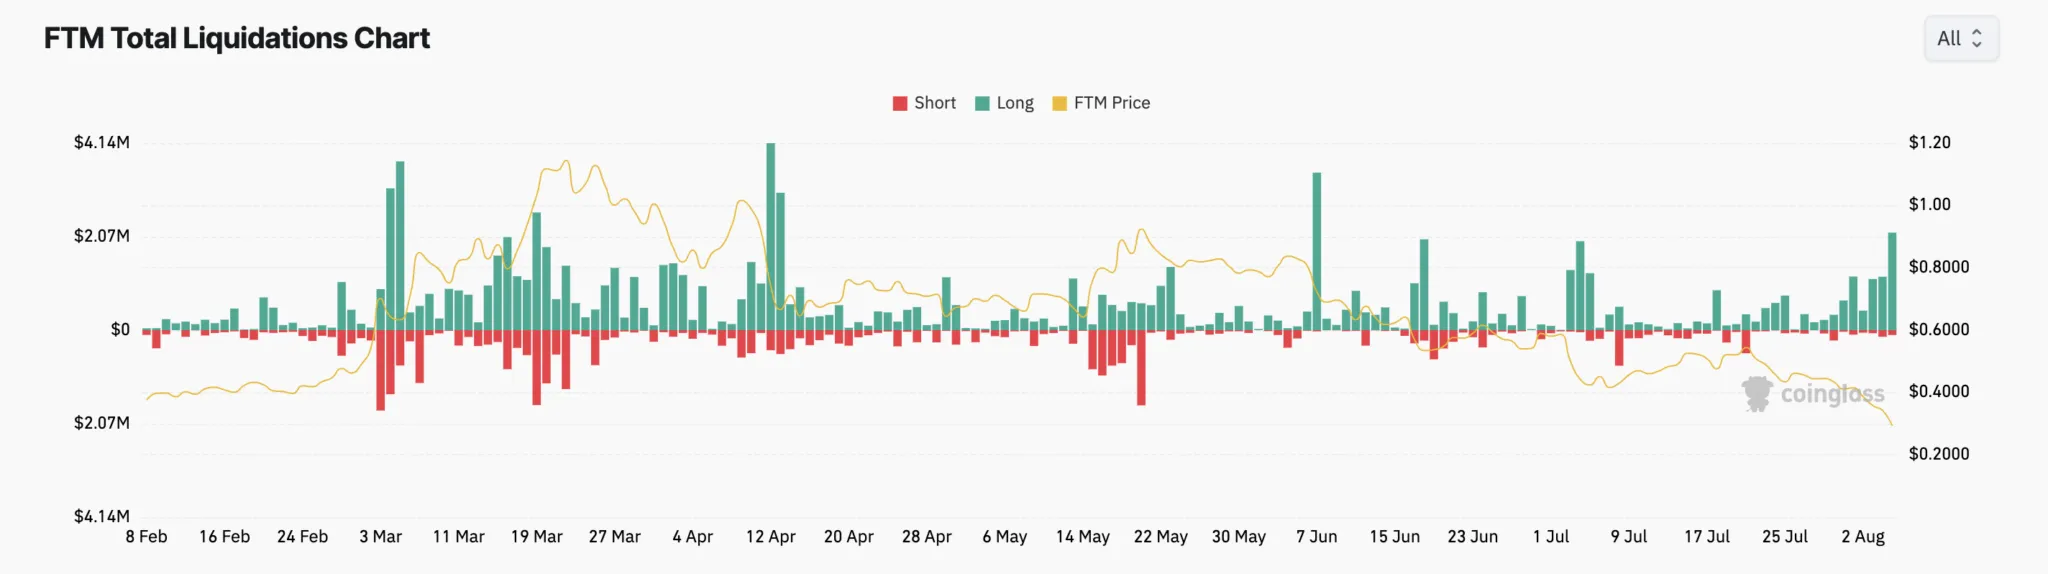
Futures investors of the asset are also not escaping losses. According to Coinglass data, several long positions were liquidated in the last 24 hours. As of the date of writing, this amounts to a total of $2.16 million, representing the highest single-day long liquidation in two months for the asset.
FTM Chart Analysis
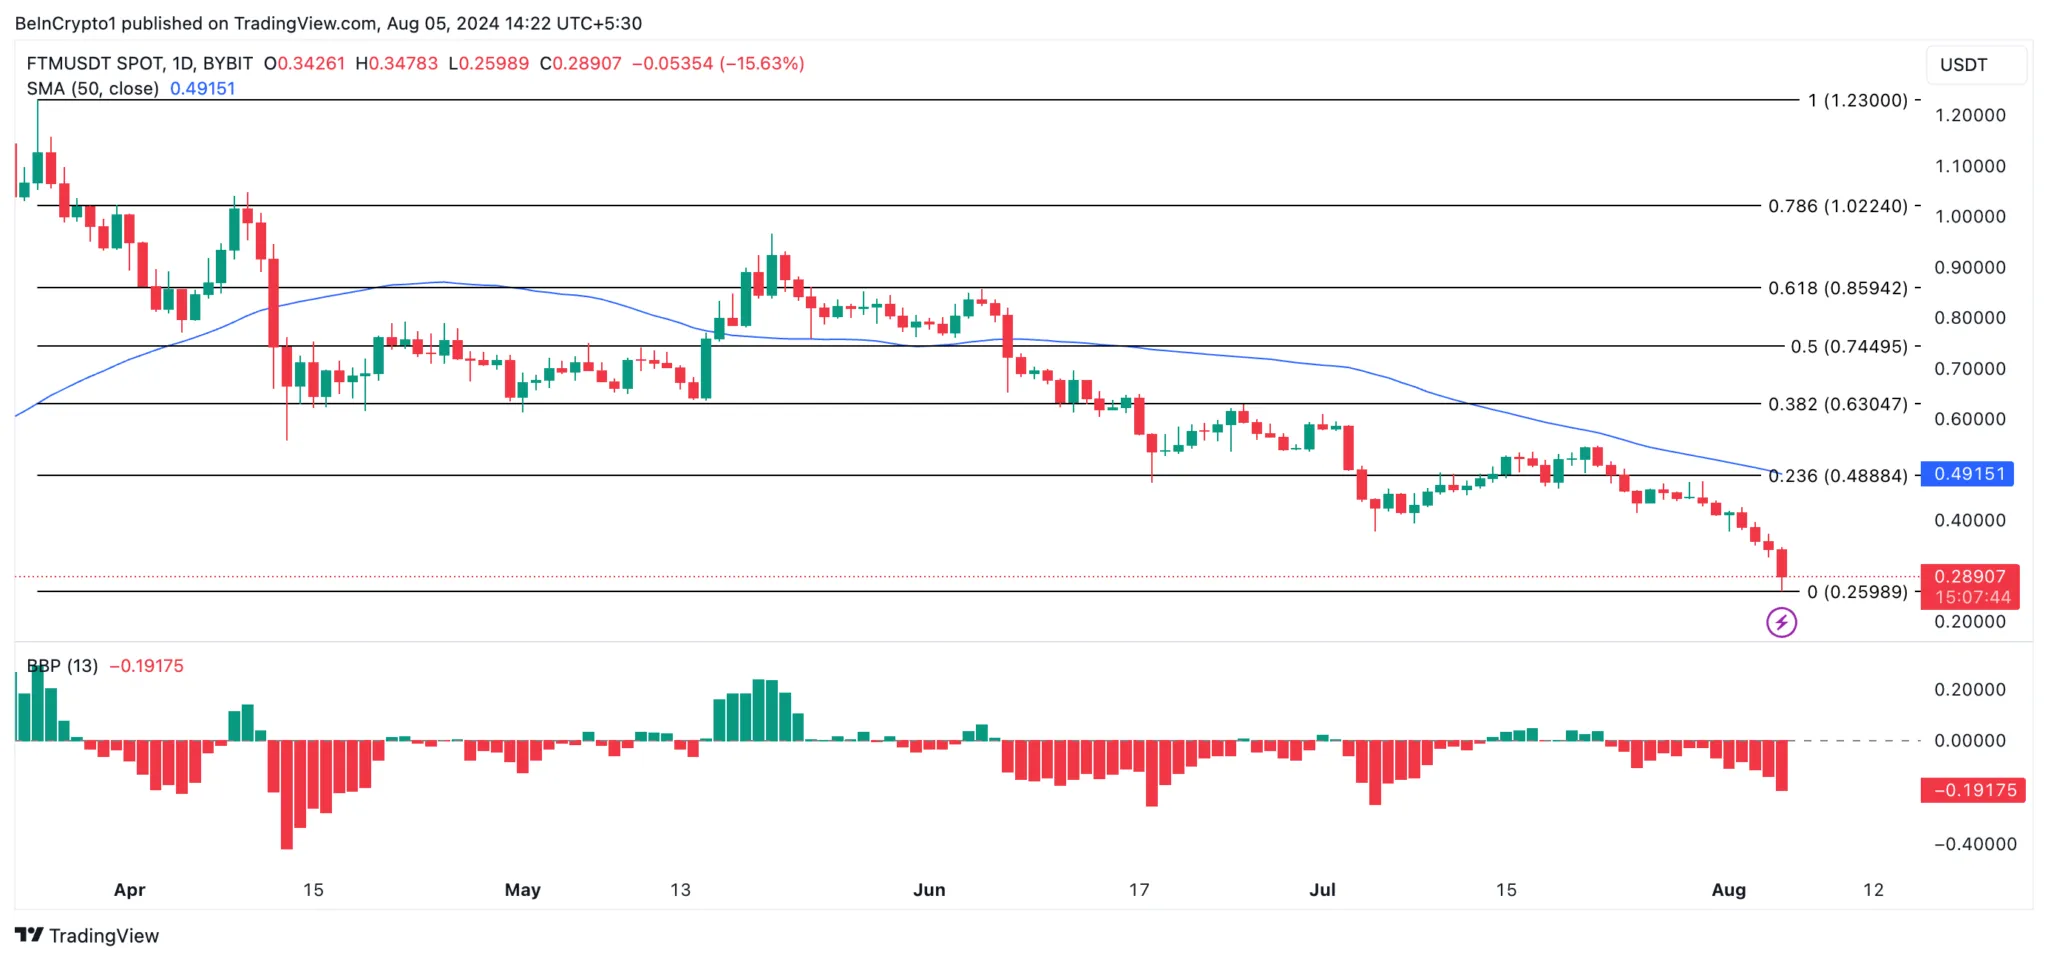
When evaluated on a daily chart, FTM’s key technical indicators point to the likelihood of further price declines. For example, the asset’s Elder-Ray Index indicates a significant bearish trend. At the time of writing, the indicator’s value was recorded at -0.19. The Elder-Ray Index measures the strength between buyers and sellers in the market. When its value is below zero, it indicates that bear power is dominant in the market.
Additionally, FTM is trading below its 20-day exponential moving average (EMA), indicating a decline in buying activity. The 20-day EMA measures an asset’s average price over the last 20 days. When an asset’s price falls below this, it indicates an increase in selling pressure. If FTM continues this trend, its value could drop to $0.25. However, if it witnesses a trend correction and demand increases, this could push its price towards the $0.48 level.