Following the move by EDX Markets, BCH Coin, the fork of Bitcoin, has gained significant attention and started a major rally. It seems like the fuel for the rockets has now been depleted. However, this rally, which is relatively based on solid ground, has created the perception among investors of whether it can “bounce back from the bottom again.” Should BCH Coin be purchased at the current price?
Bitcoin Cash (BCH) Analysis
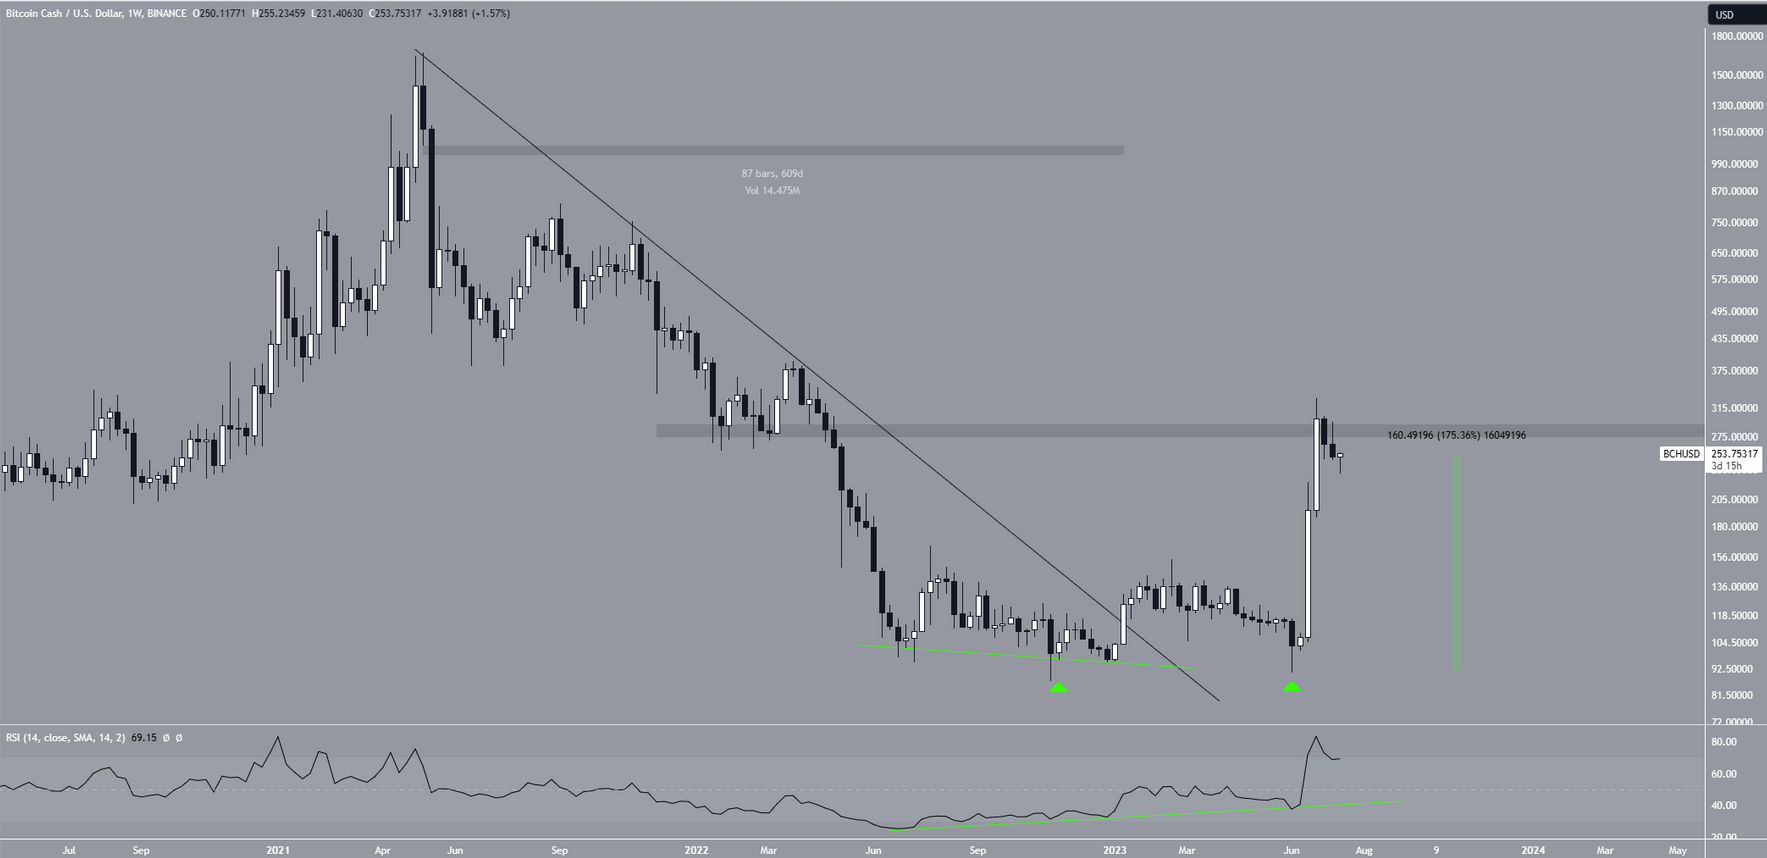
Bitcoin Cash (BCH) has been declining since reaching its highest level of the year on June 30th. However, there are signs indicating that the correction is complete. So far, the BCH price has increased by 175% without experiencing a major correction. Short-term readings indicate that the correction may have been completed and the price will continue to move upwards.
Therefore, based on the current outlook, buying the dip may be a more profitable decision than selling. EDX Markets launched its operations following the recent BlackRock news and is backed by three trillion-dollar companies, including Fidelity. BCH trading is also available on the platform. The fact that BCH Coin has found its place among limited altcoins and the increasing belief that it is not a security has formed the basis of its price surge.
BCH Coin Chart Analysis
Technical analysis for the weekly time frame shows that the BCH price is below the long-term descending resistance trendline since May 2021. During this period, BCH reached $86, slightly higher than the all-time low of $81 in December 2018.

However, the BCH price has shown significant growth since then and broke out of the descending resistance trendline that has remained in place for 609 days in January 2023. Although BCH briefly returned to pre-breakout levels in June, it quickly recovered thanks to the double bottom formation, which is generally considered a bullish sign leading to notable upward movements.
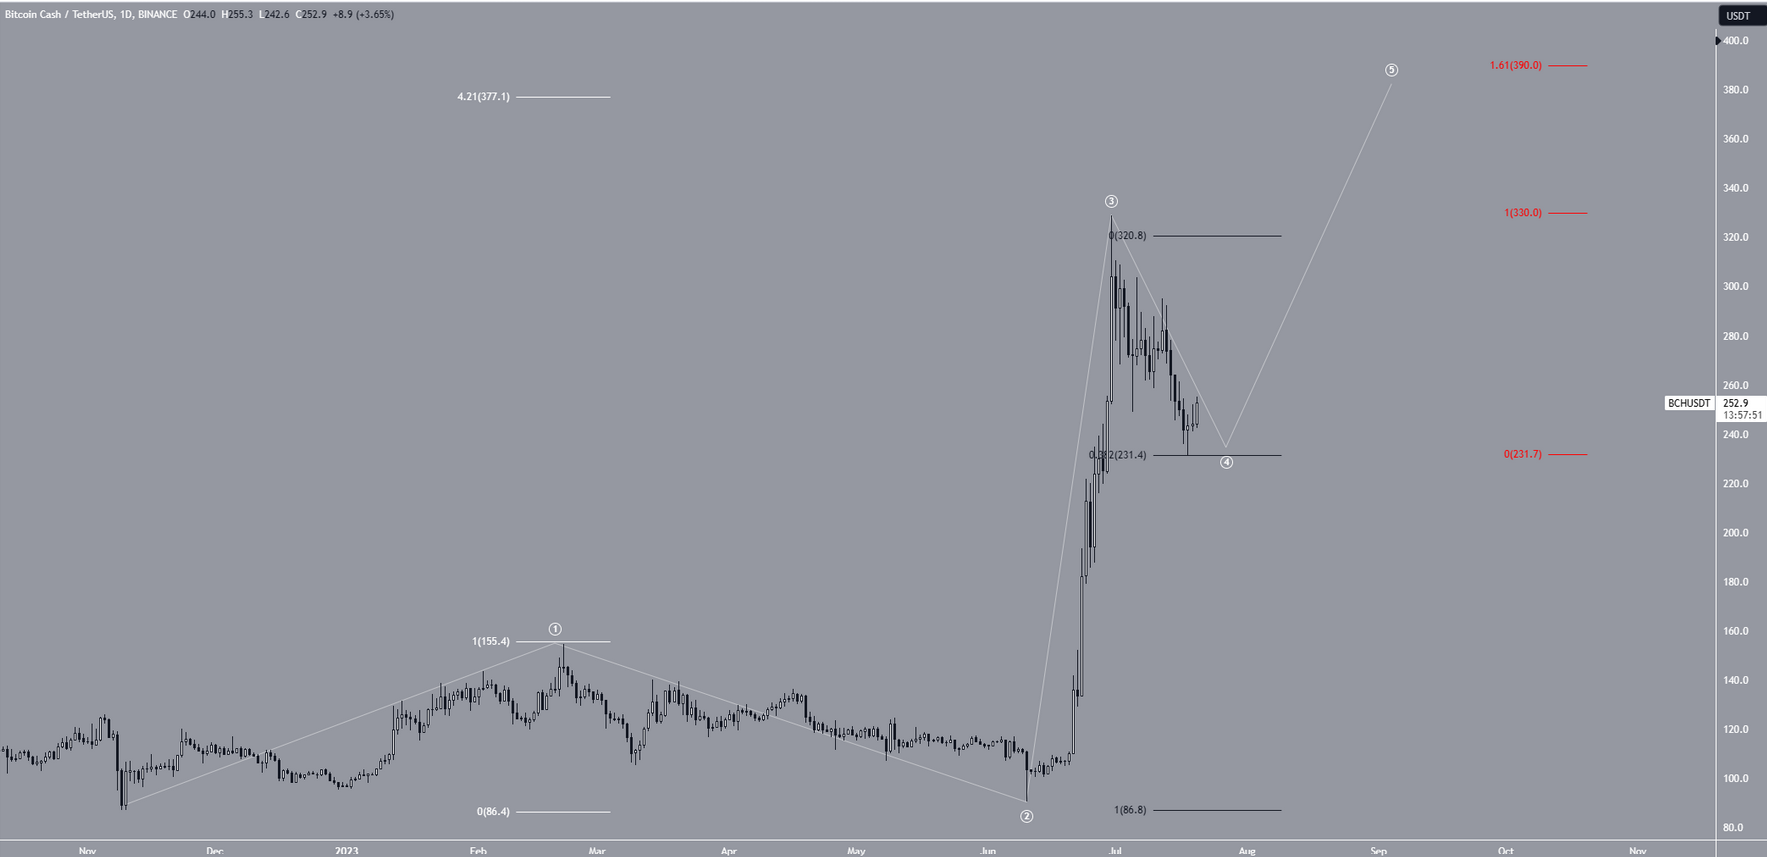
At the time of writing, the popular cryptocurrency finds buyers below $285. The RSI supports the possibility of an upward movement. The result of the Elliot wave count in the short-term timeframe is remarkable in the technical analysis. The supporting structure for the rise indicates a five-wave upward movement.

If we do not see closures below $233, a new local peak in the range of $380-390 seems likely. However, in the opposite scenario, a deeper dip below $200 could occur.

 Türkçe
 Español


