The stagnation in the price of Bitcoin may soon come to an end with the US inflation data. The king of crypto has been stuck in a narrow range for a long time. BTC‘s fluctuation between $28,800 and $32,000 has caused significant losses for altcoin investors. However, now that BTC has surpassed $29,700 again, it appears that the resistance level can be tested. So what will happen to Solana?
Solana (SOL)
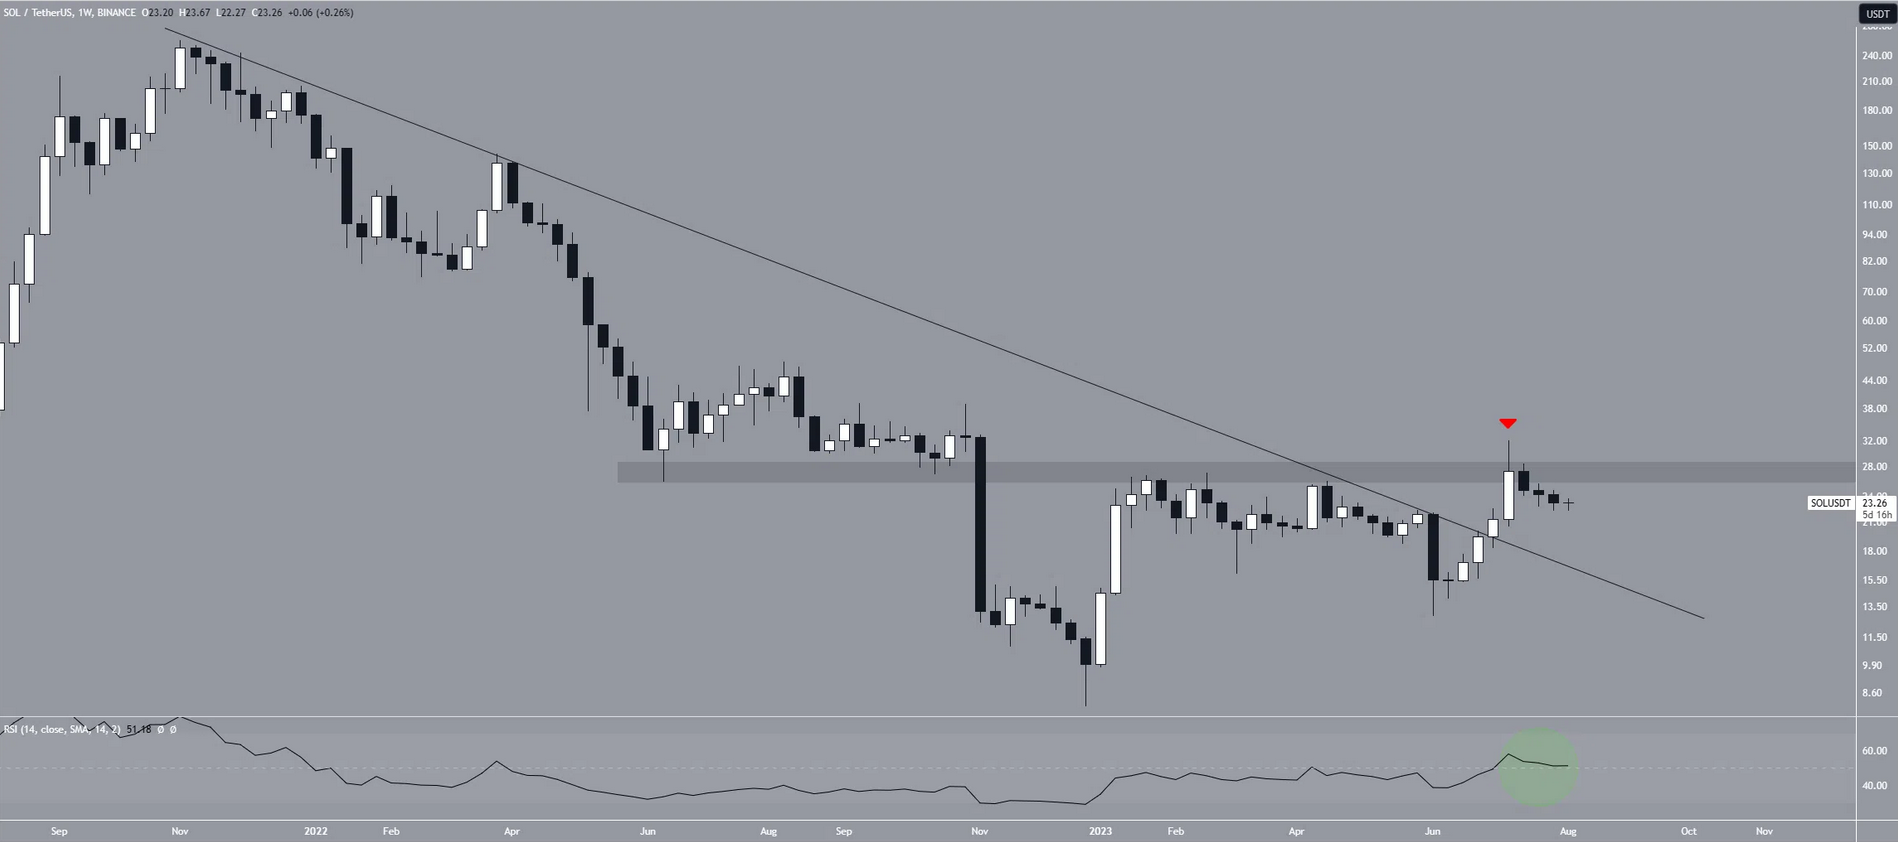
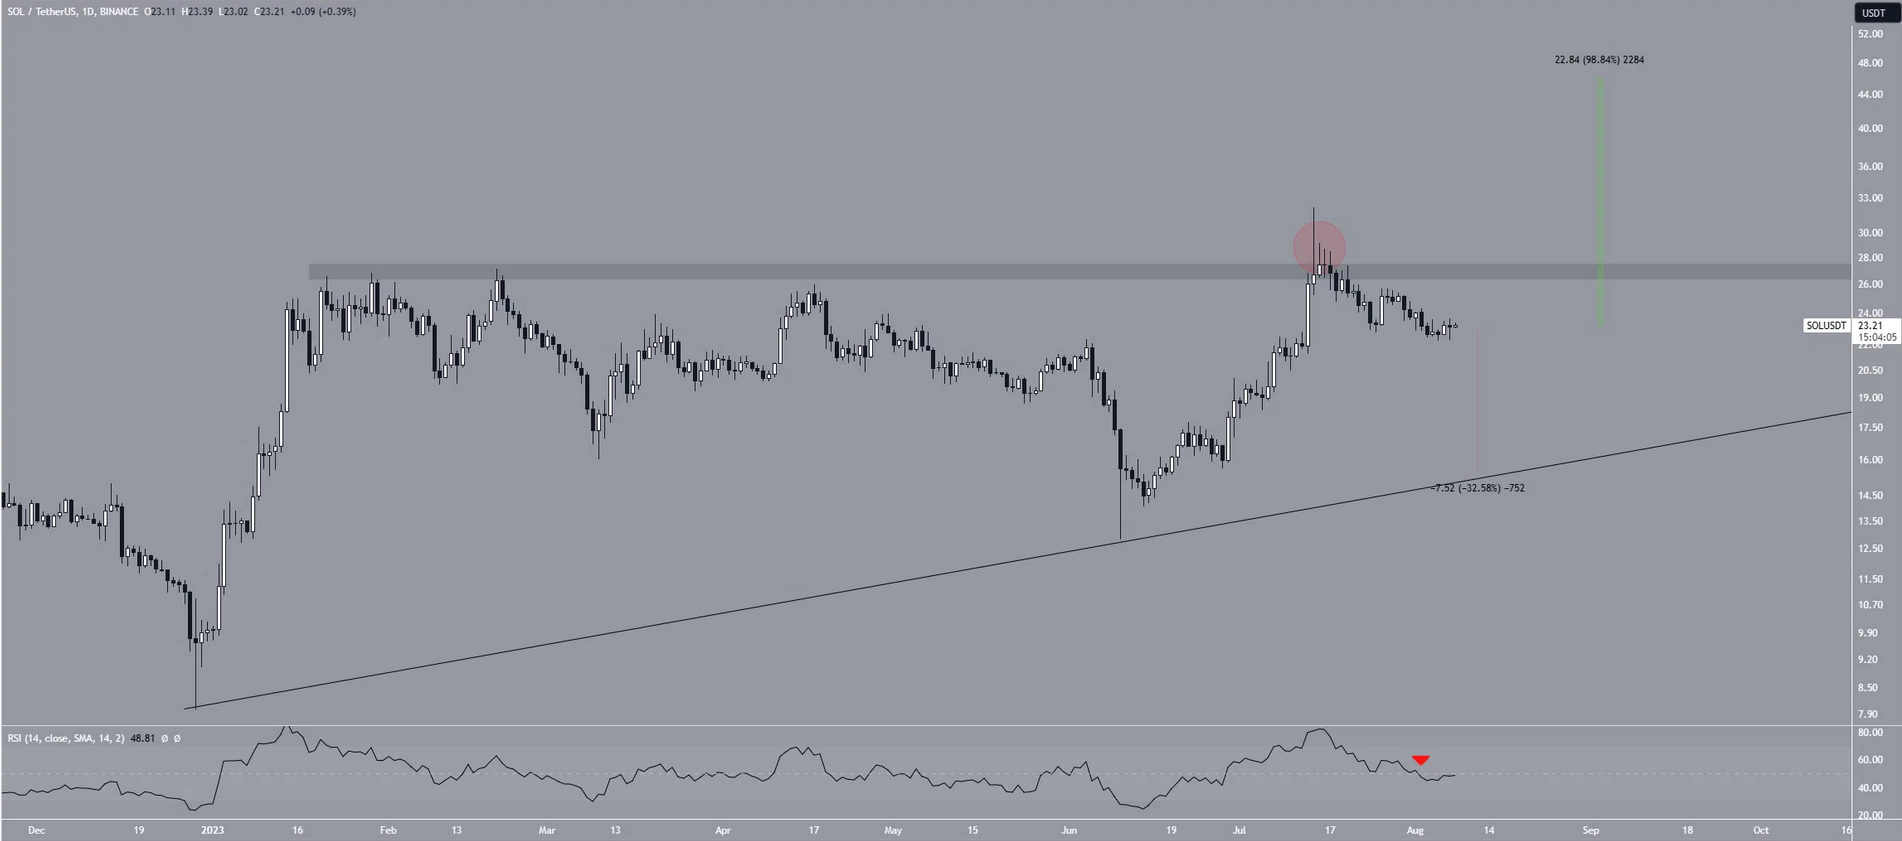
The value of Solana (SOL) steadily declined after reaching its peak of $32.13 on July 14. This decline solidified the $27 support level. At the time of writing, the price has exceeded $24 with a 6% daily increase, which was boosted by Ripple support last month. The conflicting perspectives offered by the weekly and daily timeframes make it difficult to determine the future trend. So far, the weekly trend is bullish, while the daily chart readings indicate a bearish trend.
On the other hand, what will determine the direction for altcoins despite all predictions is the price movement of Bitcoin. Although we may see altcoins that will diverge positively as an exception, significant gains in altcoins this month seem unlikely without BTC’s rise.
The weekly timeframe view derived from SOL’s price movement indicates a significant breakthrough in early July. At that time, SOL cleared a resistance line that had been active for over 600 days. Such breakouts usually indicate the end of the previous trend and the start of a new bullish trend.

The fact that many cryptocurrencies have surpassed their 600-800-day trend lines increases hopes for the overall market.
Is SOL Coin Worth Buying?
Despite a positive performance from the Solana network, the price has seen three consecutive weeks of decline. Now, as mentioned above, there is a strong $27 resistance. While the technical analysis on the weekly timeframe indicates a bullish outlook, the daily trend shows a bearish tendency. This creates uncertainty about the future trend.

The primary factor contributing to this downward trend is the divergence observed with the closing prices below the resistance zone. Such a divergence is typically seen as a bearish signal and often precedes a significant price drop. It indicates that the previous breakout was illegitimate.
If the downward movement continues, market analysts expect the long-term rising support line to halt the decline at $16. However, closing prices above $27 would dismiss the bearish scenario. In that case, the long-awaited $47 long-term resistance could be tested.

 Türkçe
 Español


