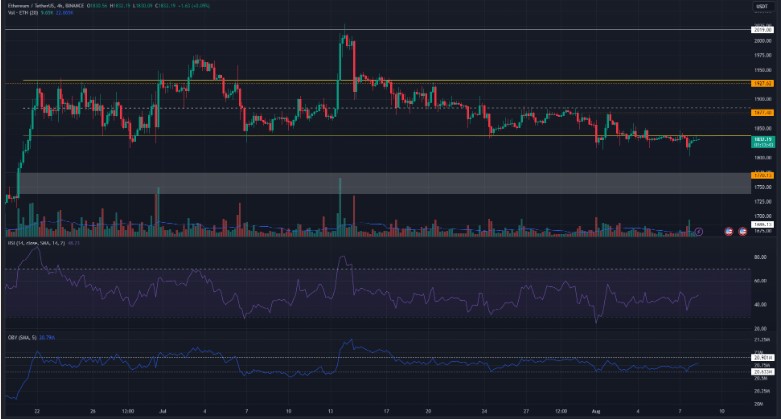
Ethereum (ETH) was trading at $1,854 at the time of writing this article and has been in a downtrend on lower time frames since July 17. Bulls failed to defend the $1,900 support area and have not put up much of a fight in the weeks since then. Although the December formation seems to have been broken, ETH appears to be holding on stubbornly at the $1,825 level. Whether bulls will soon lose this point or if this price movement signals a reversal of the uptrend is a big question mark.
Current Situation of Ethereum
On August 1, Ethereum prices saw a significant volume increase on lower time frame charts but failed to surpass the lower high level at $1,877. This was followed by a reversal and these short-term gains were completely wiped out. This situation indicated a liquidity hunt just below the lowest levels of the range on August 1.

Since then, over the course of a week, liquidity has likely accumulated just above the $1,850 level, offering invalidation of lower time frame lows for bears. Therefore, an ETH move towards the $1,850 to $1,870 region in search of liquidity was possible. Although not certain, the chart suggests that this could also be followed by a rapid downward trend.
On-Balance Volume (OBV) has shown that neither buyers nor sellers have been dominant since July 17, but the price movement has been in a downtrend. The RSI has also shown a downward momentum and has gained dominance in recent weeks.
Will Ethereum Rise?
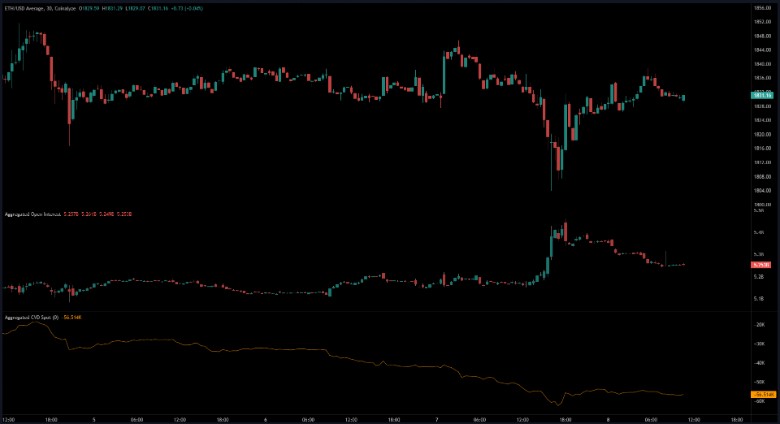
On Monday, August 7, Ethereum dropped from $1,836 to $1,808. Within a few hours, Open Interest (OI) showed a rapid increase. This was an indicator of a collective opening of short positions. When the price returned to $1,830, OI began to decrease further.
Spot CVD remained horizontal in the last 12 hours, but showed a downward trend last week. The indicators together showed a strong short-term downward trend. The recovery from $1,802 does not show the strength of the upward move, but it could be supported by short covering.
In the lower region, the demand zone of $1,750 to $1,770 could attract the price. Ethereum left a fair value gap on its four-hour chart in this zone. Furthermore, it served as support at the end of March and throughout April.


 Türkçe
 Español


