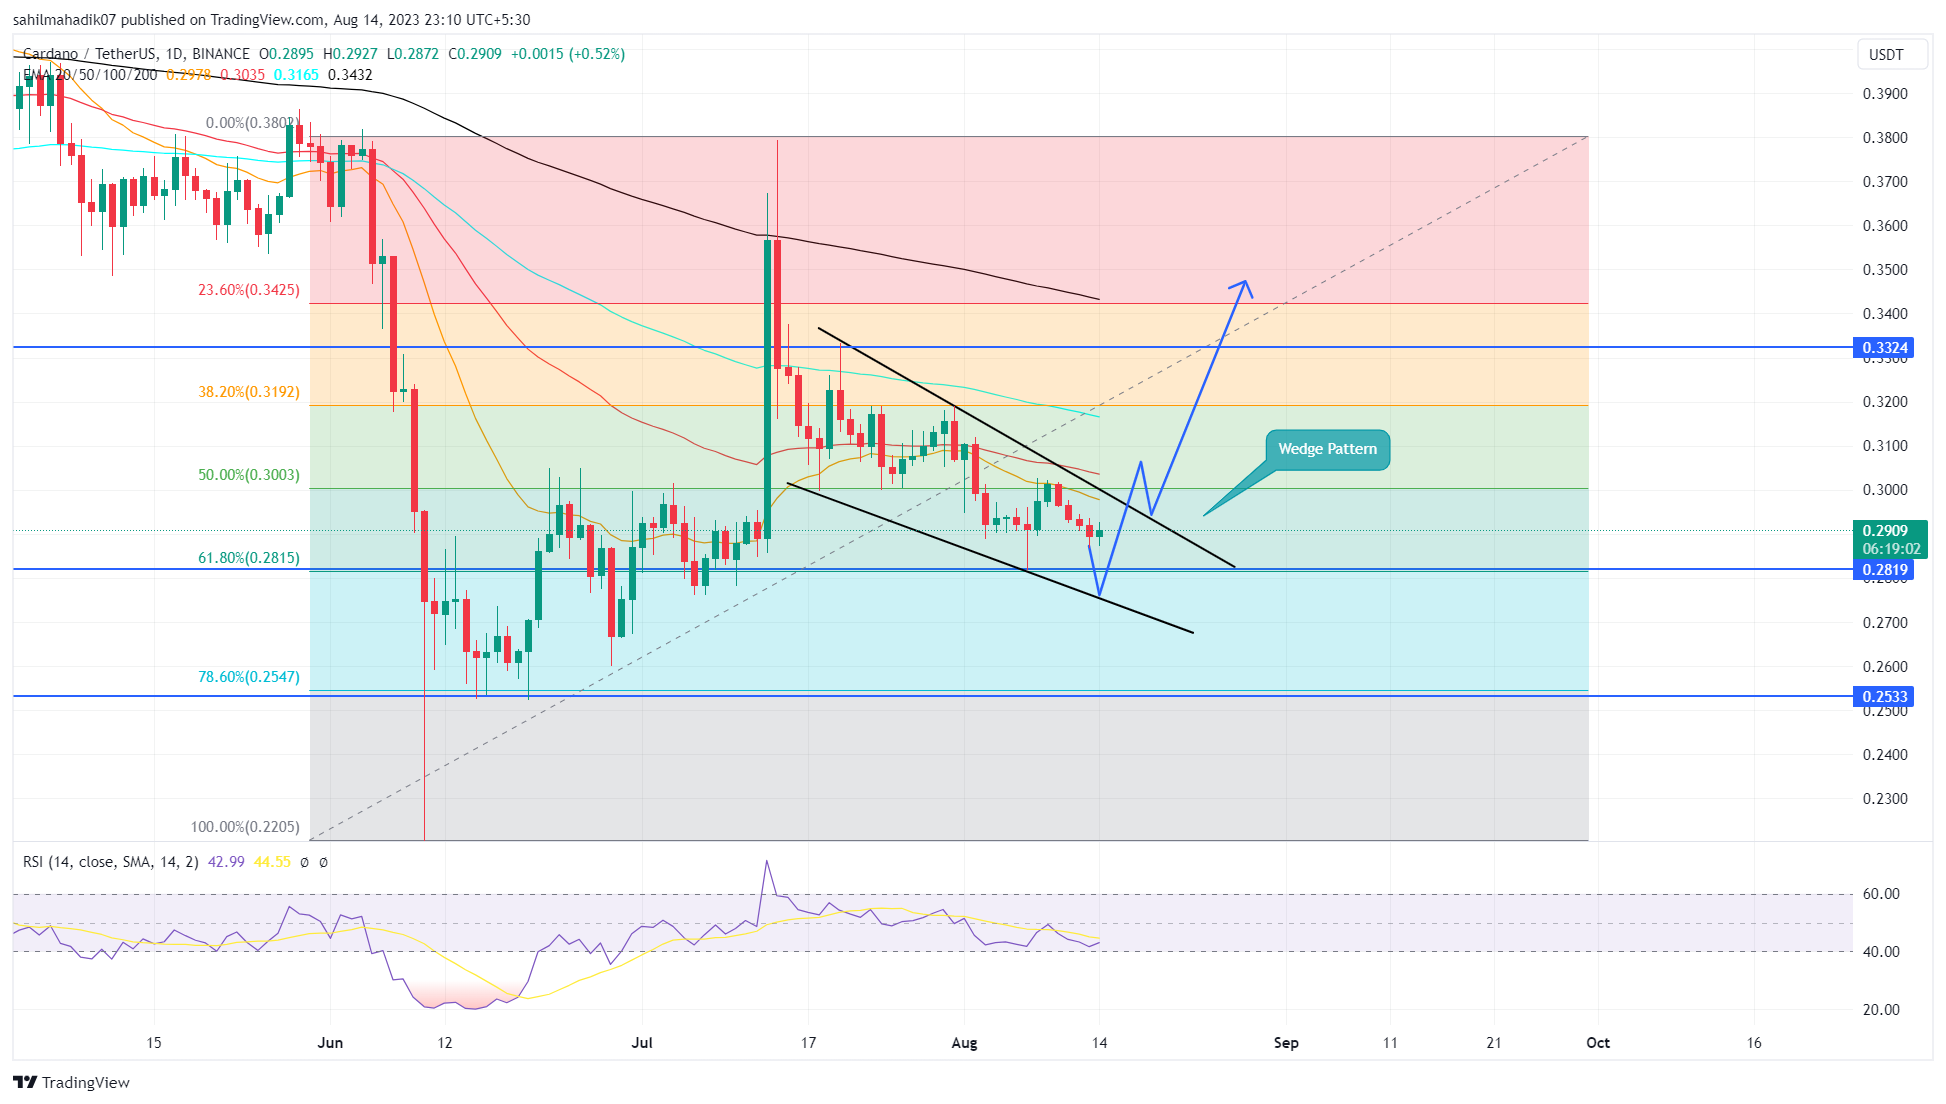
Cardano (ADA), one of the top altcoins, has seen a decline of over 23% in the past month. This price drop resulted in a falling wedge formation on the daily timeframe price chart of the altcoin. The formation is characterized by gradually decreasing prices and converging trend lines, and its completion as expected could indicate a significant bullish signal. Here is the meaning of the falling wedge formation for ADA.
Cardano Price Analysis
The price of ADA continues to decrease in response to the increasing downward momentum in the cryptocurrency market. In the midst of this decline, sellers have pushed the price below the $0.3 resistance level, supporting the possibility of further declines. If the falling wedge formation on ADA’s daily timeframe price chart does not break the resistance trend line, the price could decline to around $0.275 and the downtrend could continue.

However, investors waiting for a buying opportunity in ADA should wait for a break above the resistance trend line of the falling wedge formation. This break will serve as a crucial catalyst for a strong rally that could push the price higher. After the breakout, ADA’s price could rise to $0.33, an increase of over 11%.
Can the Decline in ADA’s Price Continue?
Although the technical outlook for ADA favors buyers, a drop below the supporting trend line of the formation could lead to a negative scenario. In such a case, the bullish scenario may become invalid and the price could decline by 13.4% to $0.24.
The upward slope of the Relative Strength Index (RSI) above 40 on the daily price chart indicates the presence of buyers with the potential to reverse the downtrend. On the other hand, the declining 20, 50, 100, and 200-day Exponential Moving Averages (EMAs) can act as dynamic resistance against buyers.

 Türkçe
 Español


