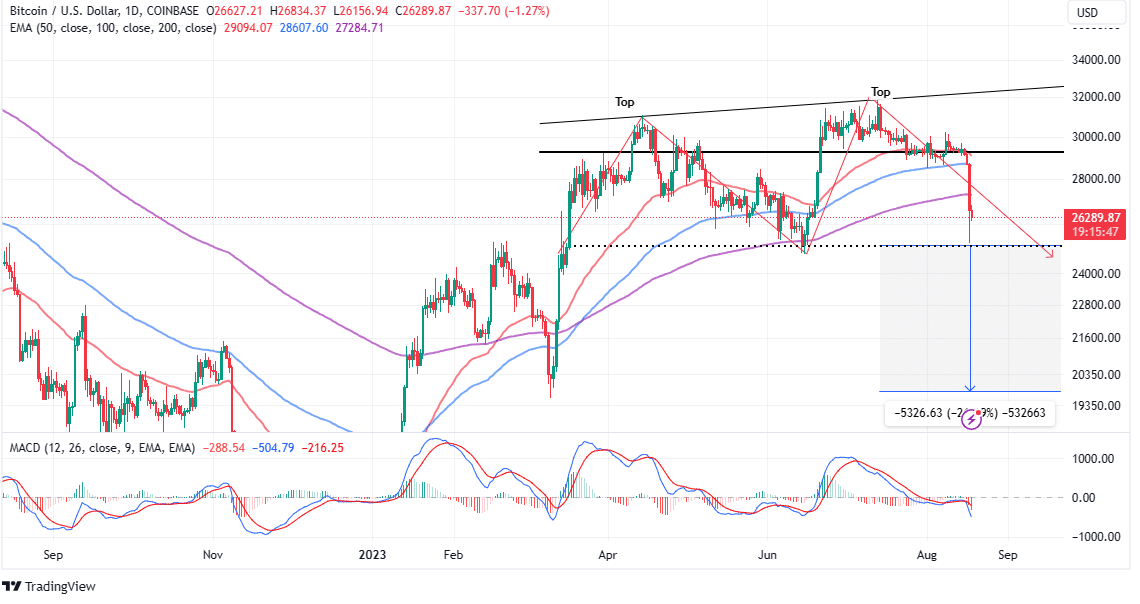
Bitcoin‘s (BTC) price continues to experience a downward trend during the Asian trading session, with a drop of approximately 8% in the last 24 hours, trading at $26,447. The largest cryptocurrency has tested levels just above $25,000 while breaking out of the channel between $29,000 and $30,000. This downward trend is closely monitored as it could confirm the double top formation on the price chart of BTC and cause the price to fall below $20,000 before any significant recovery.
BTC Price Chart Indicates Further Decline
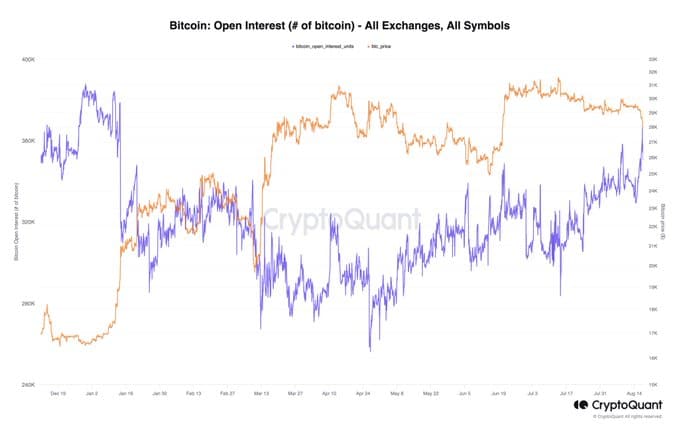
Bitcoin has recently broken out of the channel it has been moving in for a while to trigger selling that led to levels last seen in June on August 17. Both on-chain and on-chain data indicate a continued decline in prices and the possibility of BTC’s price dropping to $20,000 or below. Crypto analysis platform CryptoQuant reported in its recent assessment of the current market outlook that open interest in futures markets has been accumulating short positions at least since mid-July, even as the price dropped from $32,000.

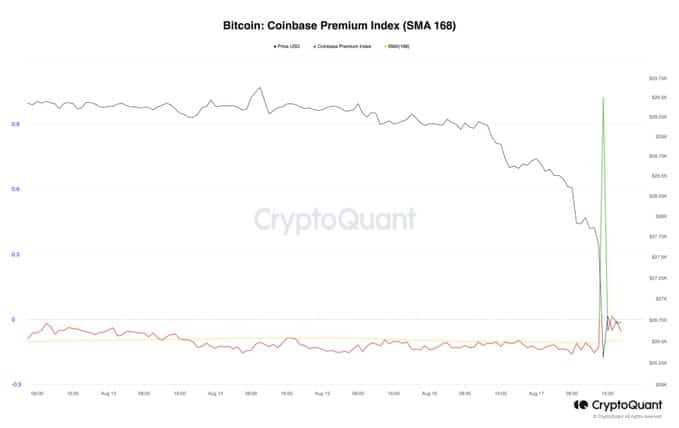
The Federal Reserve‘s hawkish stance on fighting inflation, which has not changed, has led to a significant decrease in demand for Bitcoin in the United States. According to CryptoQuant, there has been a period of low demand, especially in the US, before the sales, and this is clearly confirmed by the negative premium on Coinbase.

On-chain data also reveals that major BTC investors have doubled their spending activity before and during the sales. Furthermore, the inability of Bitcoin to break the $30,000 resistance and sustain the upward trend has resulted in a decrease in active interest from many individuals. Despite the increased spending by whales, it was not enough to reverse the price decline.

Meanwhile, long-term BTC investors may continue to hold their positions considering the historical pattern of whale spending preceding price increases.
Negative Investor Sentiment in Bitcoin
As the negative sentiment in the Bitcoin market persists, further losses are expected until the weekend, with a potential drop below $25,000. Therefore, investors are expected to be more interested in short selling BTC rather than expecting a surprise recovery. Currently, another strong sell signal that amplifies the negative sentiment comes from the Moving Average Convergence Divergence (MACD) indicator.

Bitcoin started trading above $26,200 as the European trading session began. Investors are closely monitoring the $25,000 support level, and if this support is broken, long-term losses down to $20,000 could occur. A drop below $25,000 would confirm the double top formation. On the other hand, many market experts and analysts believe that a possible recovery in Bitcoin could start in the range of $23,500 to $24,000.


